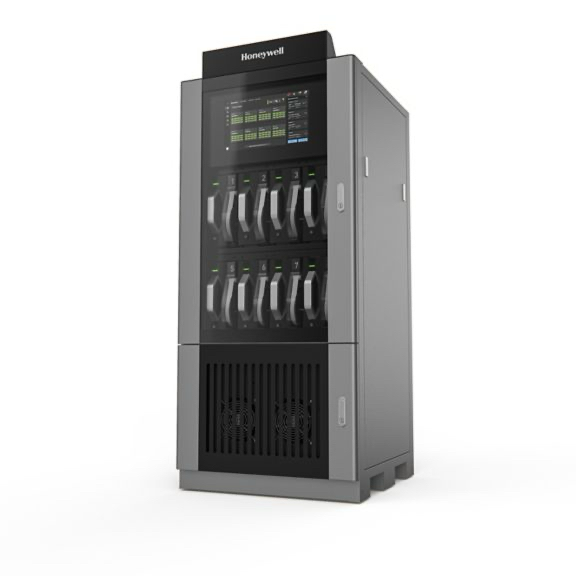
As the UX/UI Lead for the Vertex One program, I led the end-to-end design of Honeywell’s next-generation toxic gas monitoring system for semiconductor fabs—an evolution of the award-winning Vertex Edge platform. The project integrated hardware, embedded interfaces, and cloud-ready HMI software to improve serviceability, ergonomics, and usability in high-containment environments.

UI/UX Design
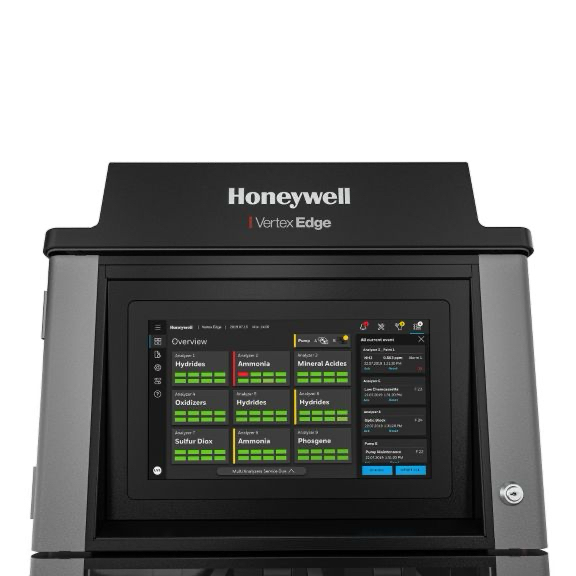
I was responsible for designing the new UI for VertexONE which required pixel-perfection and creatively reimagining the product with a new vibrant look and feel that matched the Honeywell brand. I adapted the design system and created components that would work specifically for a large tablet-like interface. The resulting experience was viewed favorably by stakeholders including leadership.
Vertex One Design Workshop – Summary and Outcomes
Held at Honeywell’s Lincolnshire headquarters, the Vertex One UX Workshop brought together cross-functional stakeholders from product management, engineering, human factors, and field services to align on the next-generation Vertex One vision. The session focused on reimagining the human–machine interface (HMI) and overall user experience for toxic gas detection in high-risk semiconductor FAB environments. As the UX Design Lead, I helped shap the workshop agenda, methods, and synthesis framework that guided subsequent concept validation at Samsung Austin. The workshop surfaced key challenges in integrating and maintaining Vertex systems, with emphasis on cybersecurity, preventative maintenance, documentation, system upgrades, and service efficiency. Discussions included field service team members for Intel, Samsung, and other partner accounts.
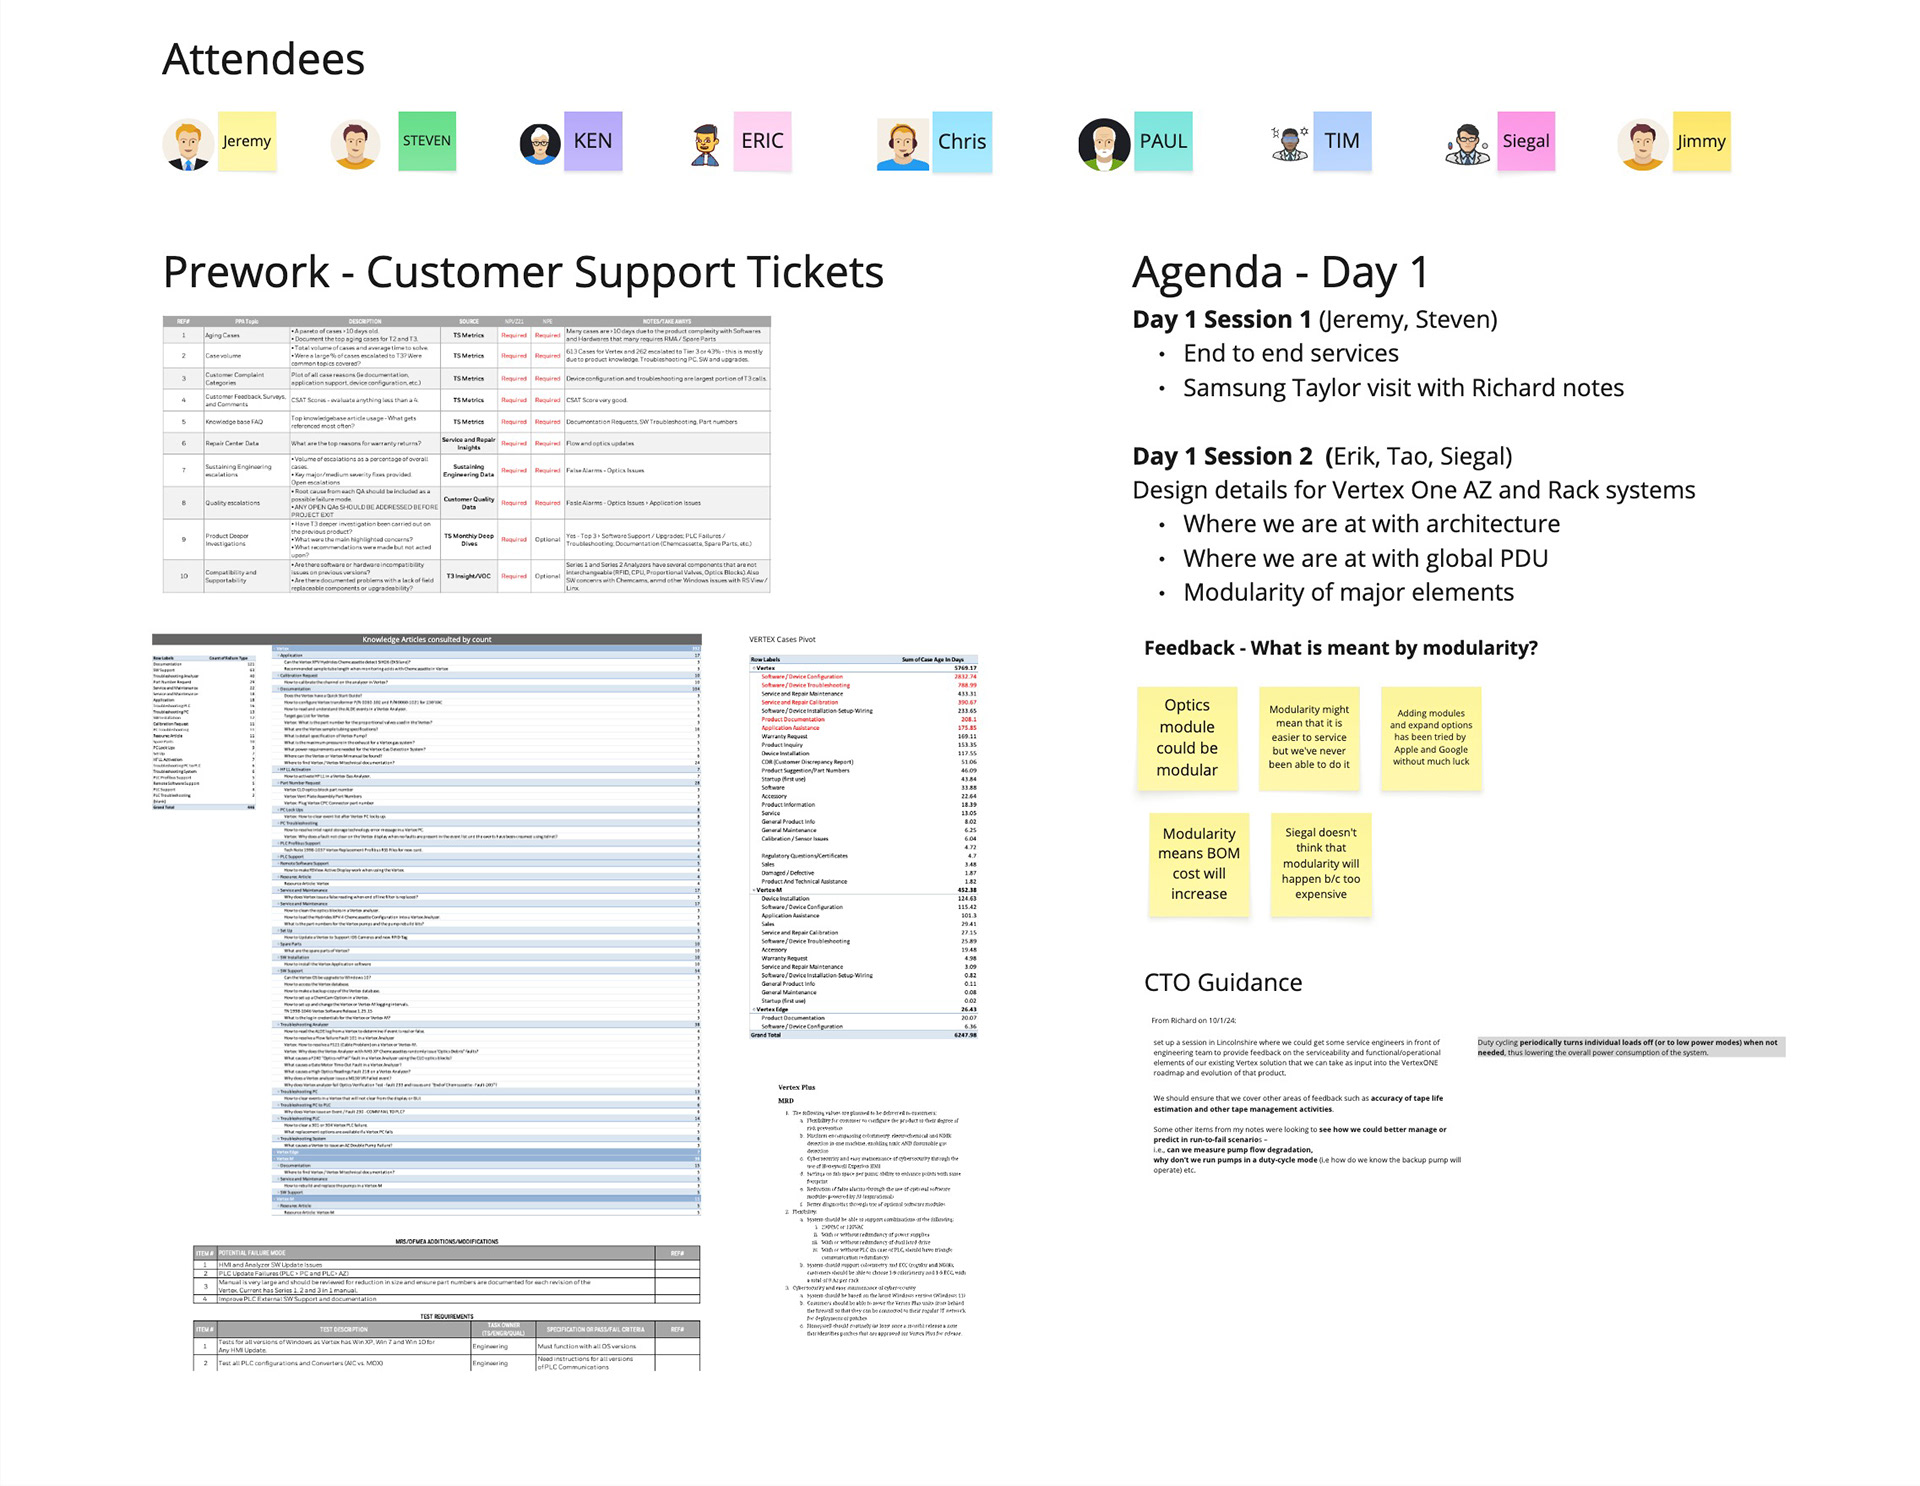
Prework and agenda
The technical support performance analysis revealed key factors affecting customer experience and service efficiency for the Vertex product line. The study identified documentation, software support, and analyzer troubleshooting as the top drivers of customer assistance requests.
Key insights:
• Documentation issues account for the highest number of tickets (121) and the most accessed knowledge articles (100+).
• Frequent causes of warranty returns and escalations include false alarms and optics-related issues.
• Hardware-related searches indicate a strong reliance on replacement parts knowledge, particularly for optics, pumps, and PLC components.
• Top knowledge-base searches—software installation, optics maintenance, flow and fault codes, and calibration—mirror the main escalation categories.
Together, these patterns show that user friction peaks during installation, configuration, and maintenance workflows—especially around software compatibility, optics calibration, and documentation clarity. Streamlining these areas with improved procedural guidance, interactive digital tools, and enhanced remote diagnostics could significantly reduce escalation rates and technician downtime.
Workshop sessions
Over four collaborative workshop sessions, a cross-functional team—including field service engineers, tech support leads, software developers, mechanical and electrical engineers, systems engineers, offering managers, and global fellows—examined the end-to-end customer experience of Honeywell’s gas detection systems.
Day 1:
Discussions focused on service inefficiencies, training gaps, and nuisance alarms in semiconductor fabs. Human factors were central, referencing Fitts’ Law, ergonomics, and Nielsen Norman heuristics to assess HMI usability. Microsoft Copilot supported synthesis by summarizing transcripts and quotes. A review of the Samsung customer visit highlighted repair turnaround challenges, pump reliability, and system architecture issues, leading to analysis of PLC configuration, alarm logic, modular design, and HMI responsiveness.
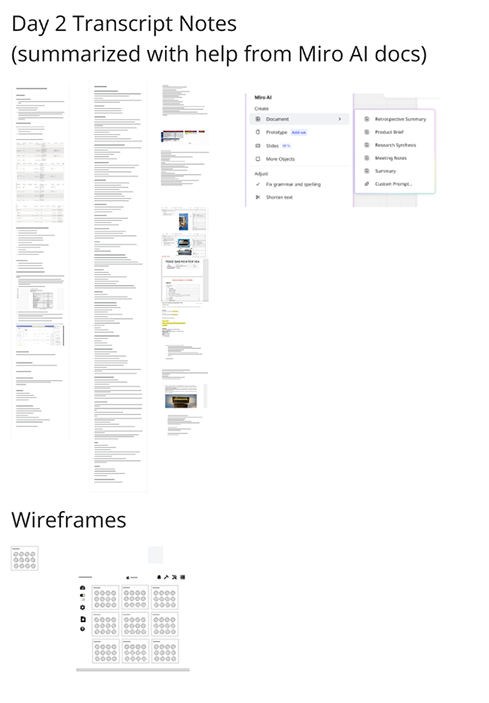
Day 2:
Using a “How Might We” framework, the team generated actionable ideas to automate reporting, improve training and diagnostics, reduce false alarms, and predict failures. Key opportunities included improving Chemcassette maintenance, parts replacement, software releases, PLC and pump duty cycles, and predictive tools to drive reliability and service excellence.
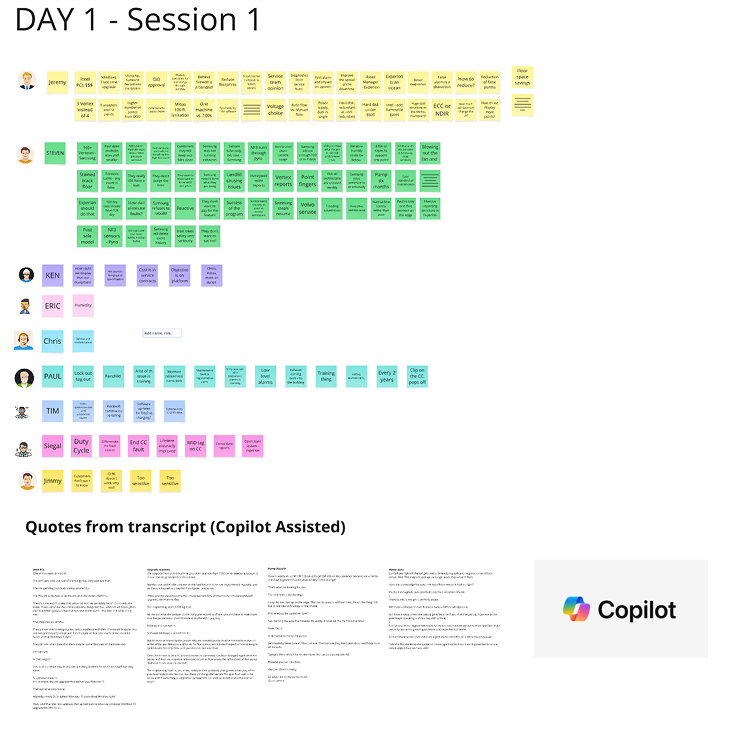
Talked about end to end services provided and pain points customers are experiencing. Included field service technicials at large and small fabs and the head of mainetnance and the head of tech support as well as software developer, mechanical engineers, electrical engineers, systems engineer, offering manager, project owner, fellows from Korea, China, USA, India, and Eastern Europe
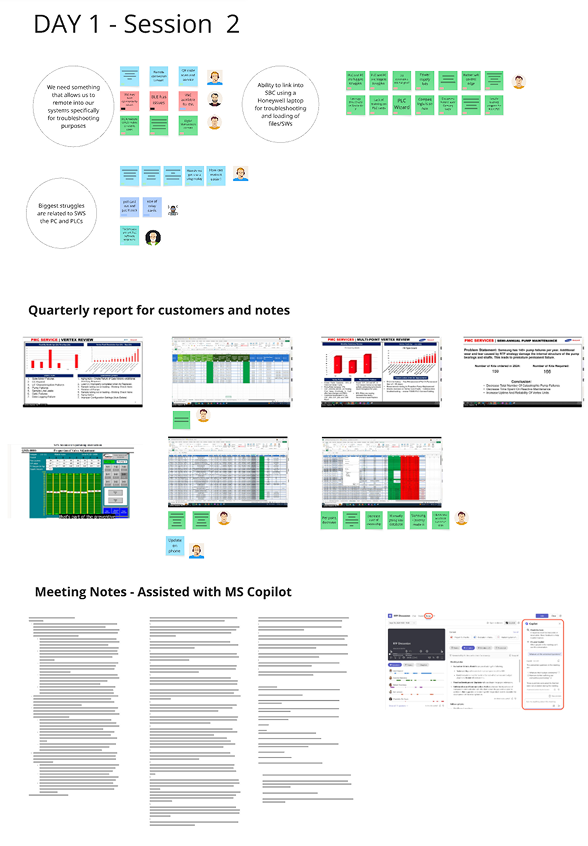
Discussed amsung visit and quarterly report as well as guidance from CEO. Discussed architecture, key failure points, repair-first mindset, case volume at Samsung, long turnaround times, system configurations, pump issues, and training issues. In addition focused on PLC comms and reducing escalations
Discussed human factors including Paul Fitt’s model, ergonomics, touch screen, 10 heuristics from Norman Neilsen. We also discussed key influencers and pesonas. Lastly we brainstormed on how we improve on faults and trainings as well as false alarms. It was a continueation of discussion from previous day and we looked at PLC configuration, Alarm latching, modular design, tubing and HMI
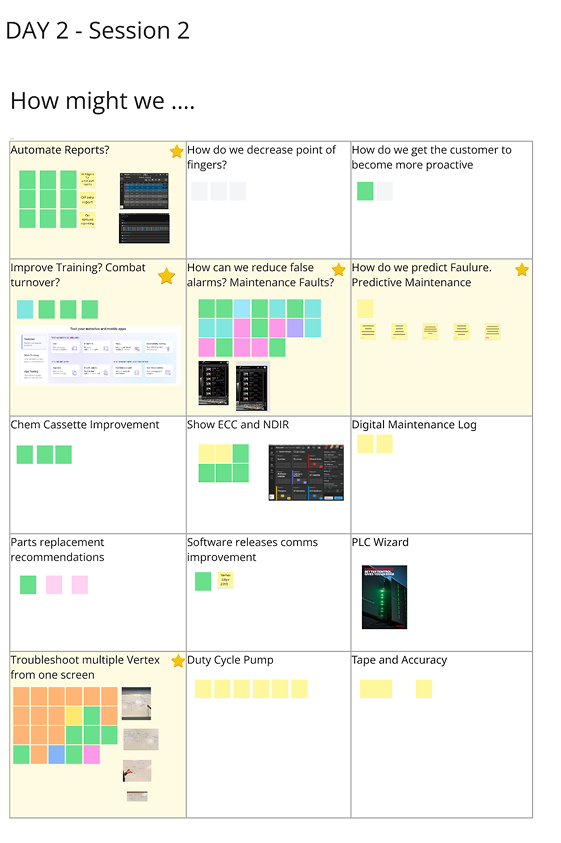
I conducted a How Might We discussion based on all the current themes form the previous sessions. These included asking the cross-functional team how might we automate reports, improve training, reduce false alarms, predict failure and troubleshoot more efectively. We als look at imporving chemcassete, parts replacements, software release, PLC, duty cycle pump and tape accuracy as well as customer pointing fingers and encouraging customerto become more proactive
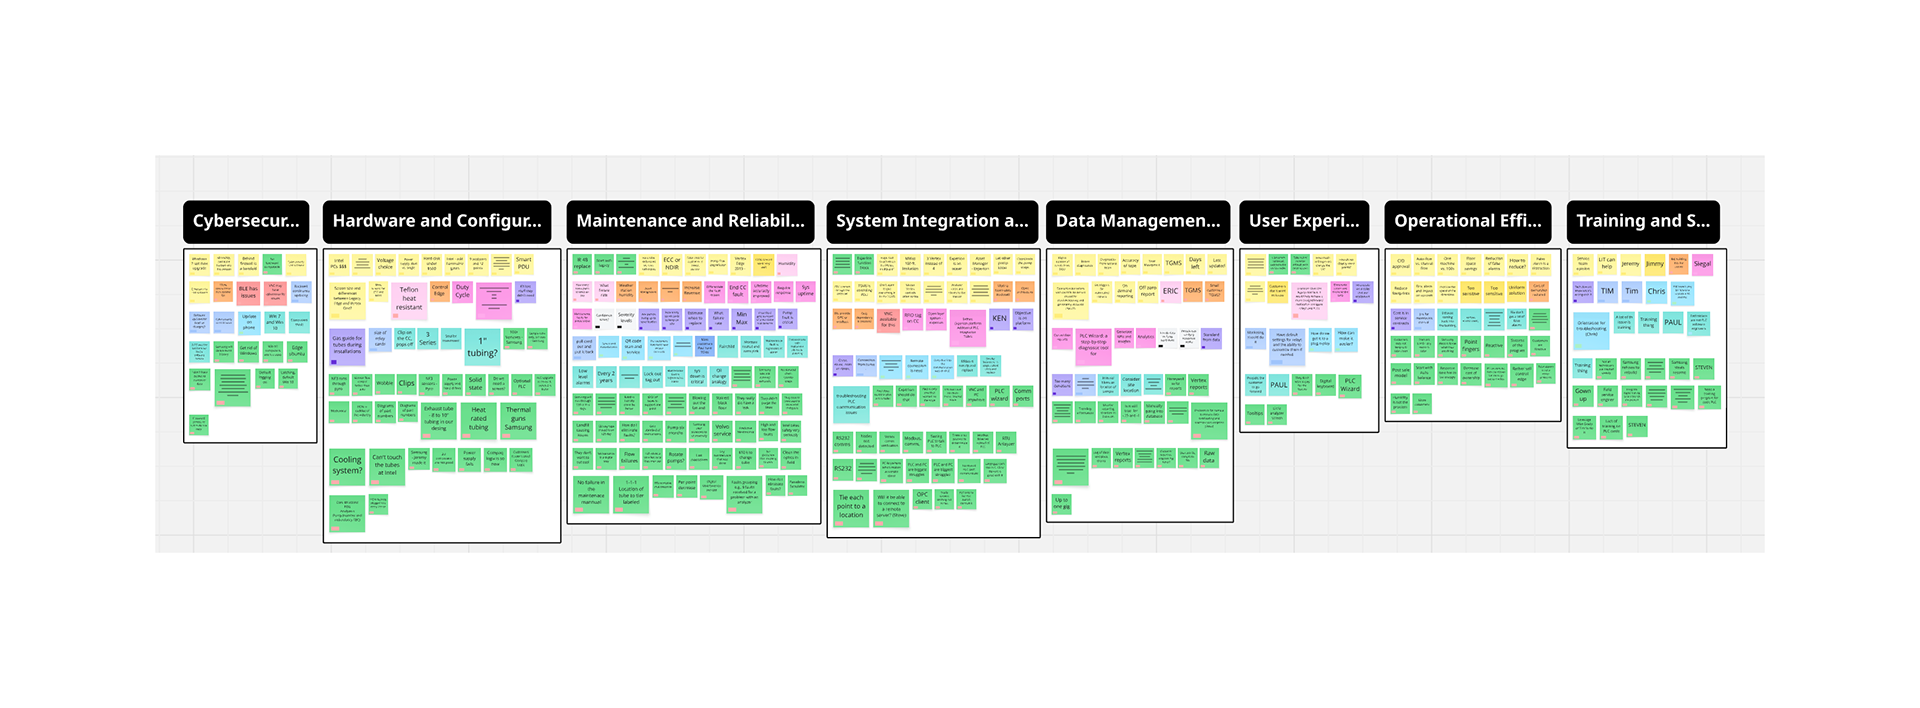
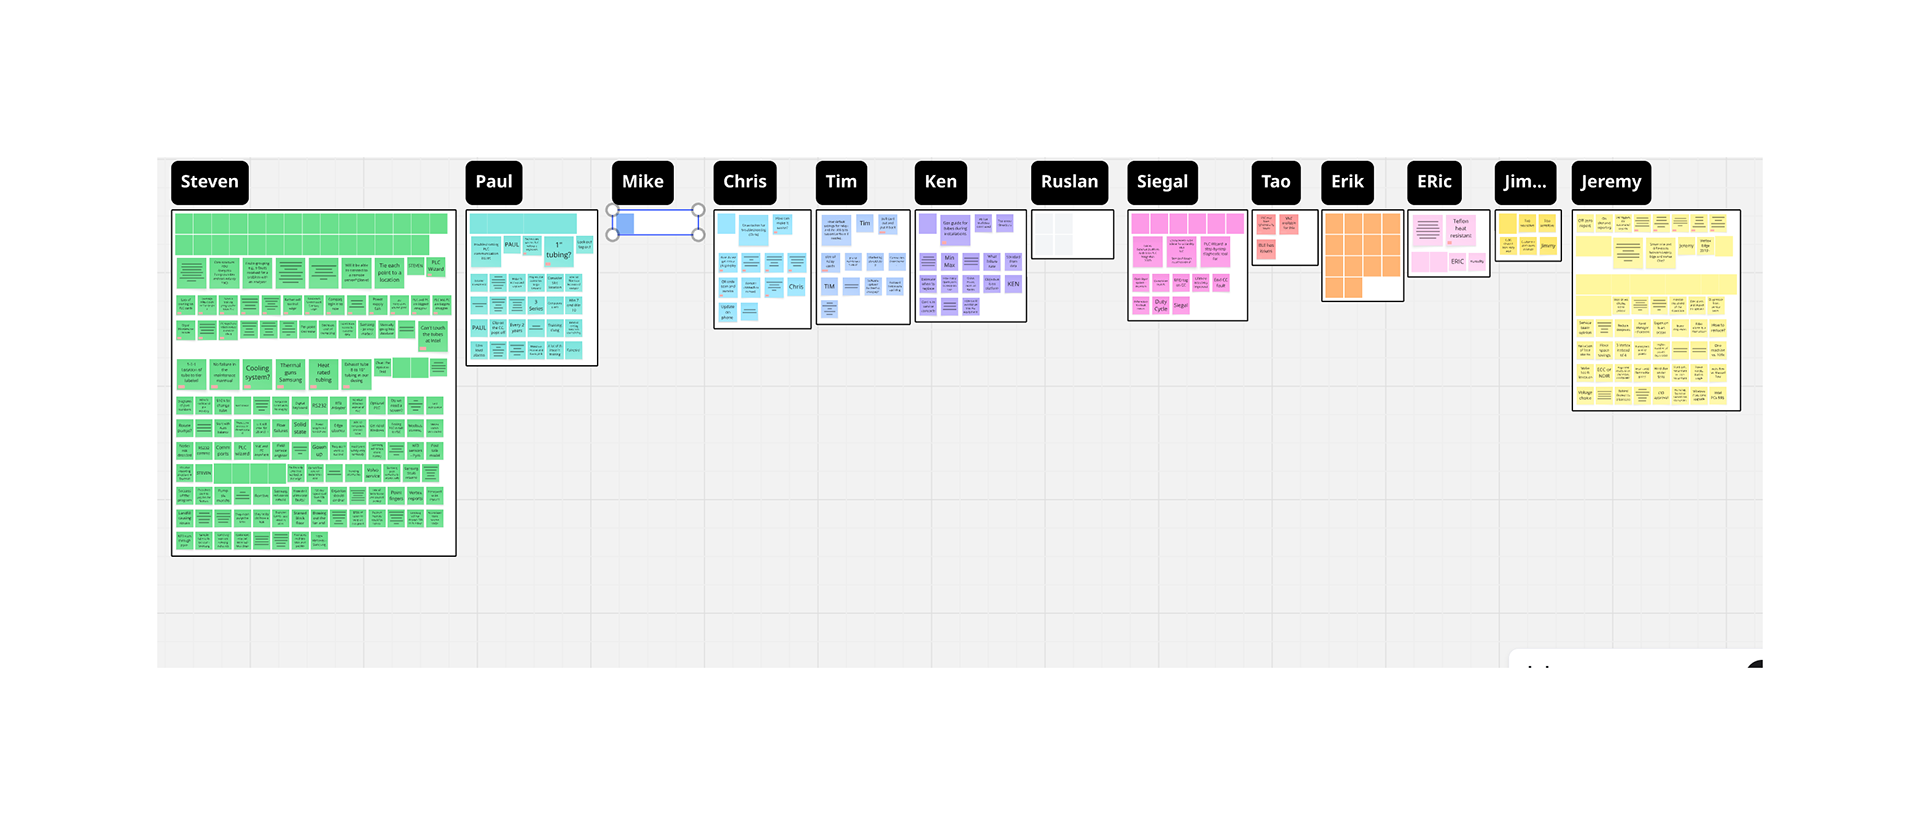
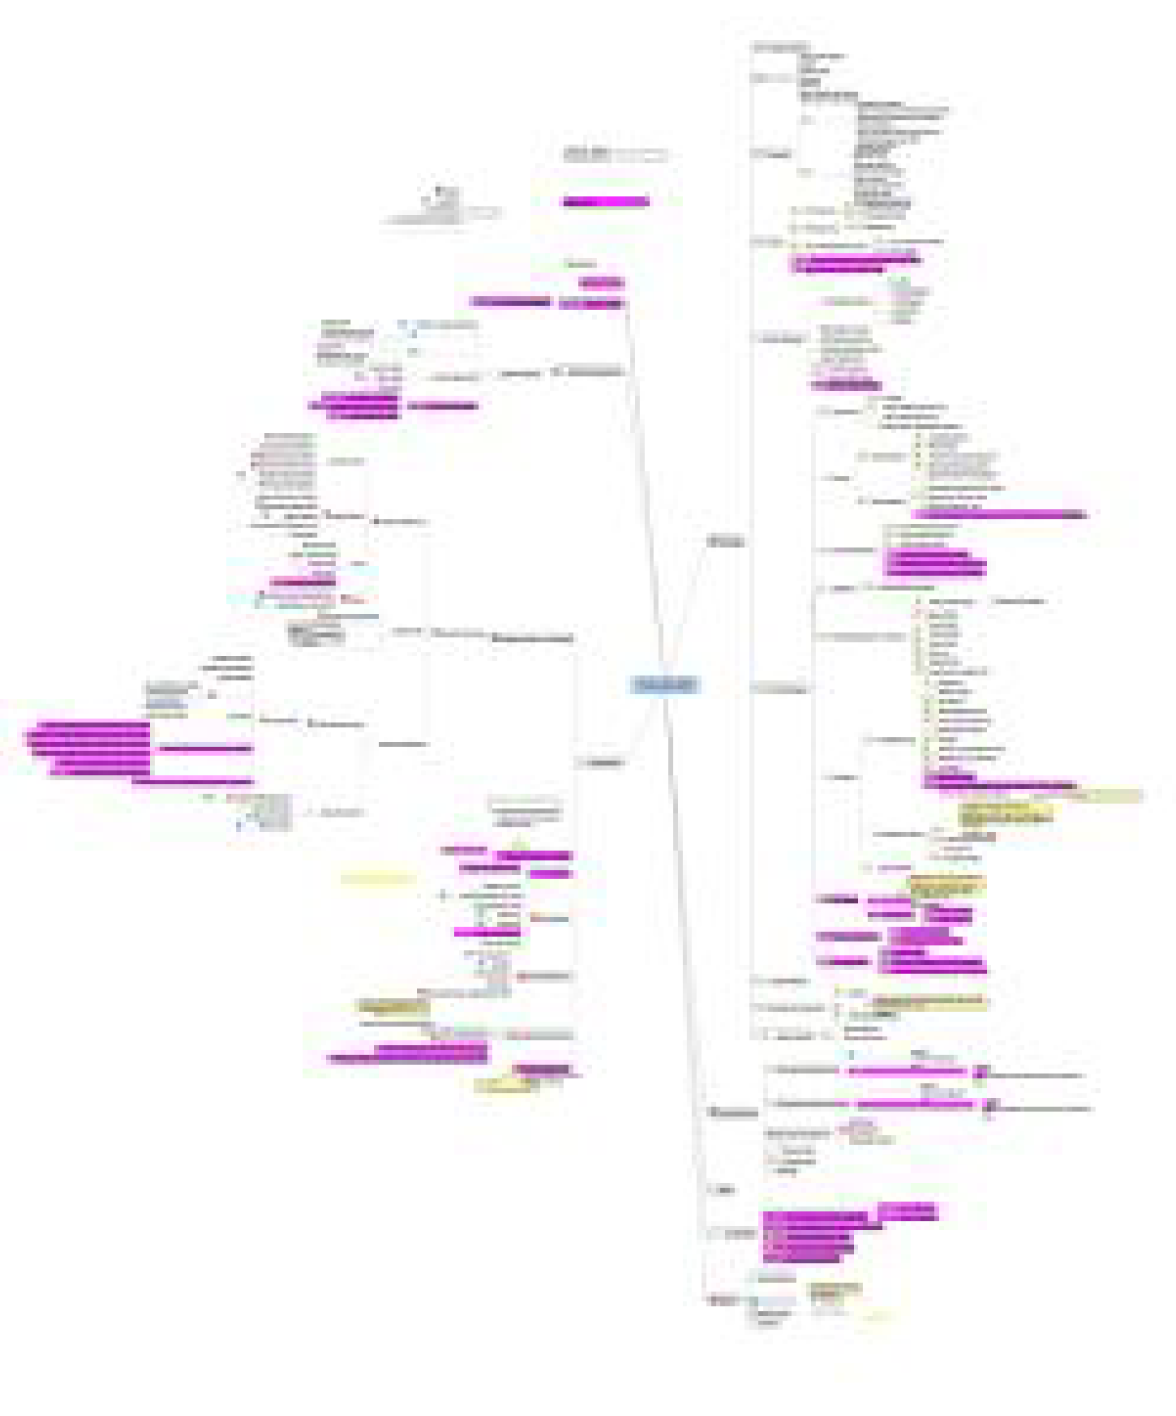
Clustering and AI synthesis
I organized all notes from the Day 1 and Day 2 workshops, first clustering them by the speaker’s name. Then, I used AI to group the notes by keyword and sentiment. Each note is now tagged by both name and keyword, giving us richer context and faster access to insights. From this process, clear themes have begun to emerge, including cybersecurity, hardware and configuration, maintenance and reliability, system integration, data management, user experience, operational efficiency, and training and support.
These findings reinforce our initial pre-work and include new insights and anecdotes from FSEs explaining root causes. For example, flow rate fault alarms may result from CC wobble, while frequent downtime and support cases often stem from limited understanding of preventative maintenance.
We brainstormed recommendations such as in-app tips to address training gaps and AI-driven custom guidance based on environmental or location data. Additional ideas include improved in-app documentation, diagnostics with recommended actions, clearer software versioning, and step-by-step guides for optics cleaning.
Automated reporting could deliver tailored insights for different audiences, while remote troubleshooting and clearer Chemcassette visuals could reduce inefficiencies and miscommunication.
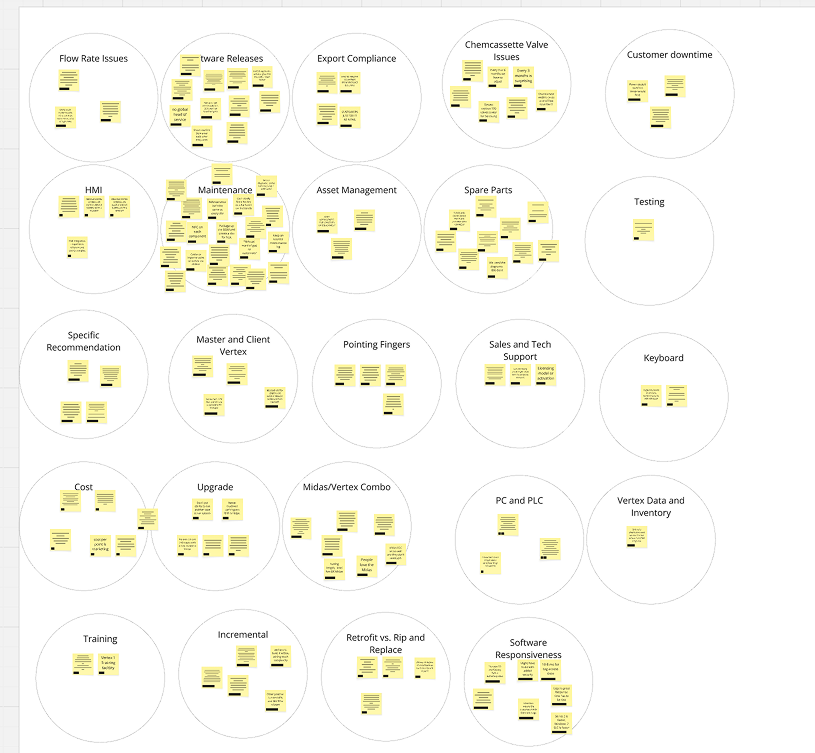
Putting it all together
I gathered all information from workshops, tech support, meetings, and post-workshop debriefs, then sorted it into 20 themes. These would be pared down further to help us prioritize the best solutions and mitigate risk.
Themes identified during the analysis centered on configuration/installation, maintenance, and user experience. Configuration themes included software configuration, PLC configuration, upgrades, Chemcassette installation. Maintenance themes focused on documentation quality, preventative maintenance, spare parts management, valve performance, flow rate faults, optics issues and training. Finally, user-facing themes highlighted HMI improvements, specific troubleshooting recommendations, customer downtime and opportunities for Midas/Vertex integration.
With the workshop complete and key themes identified from pre-work with technical support tickets, stakeholder interviews, and the How Might We session, we now have clear priorities and initial solution paths to pursue. Themes such as documentation, configuration, custom recommendations, preventative maintenance, and PLC issues have emerged as core areas of focus. Next, we’ll examine the note clusters around these themes to determine where to concentrate our efforts.
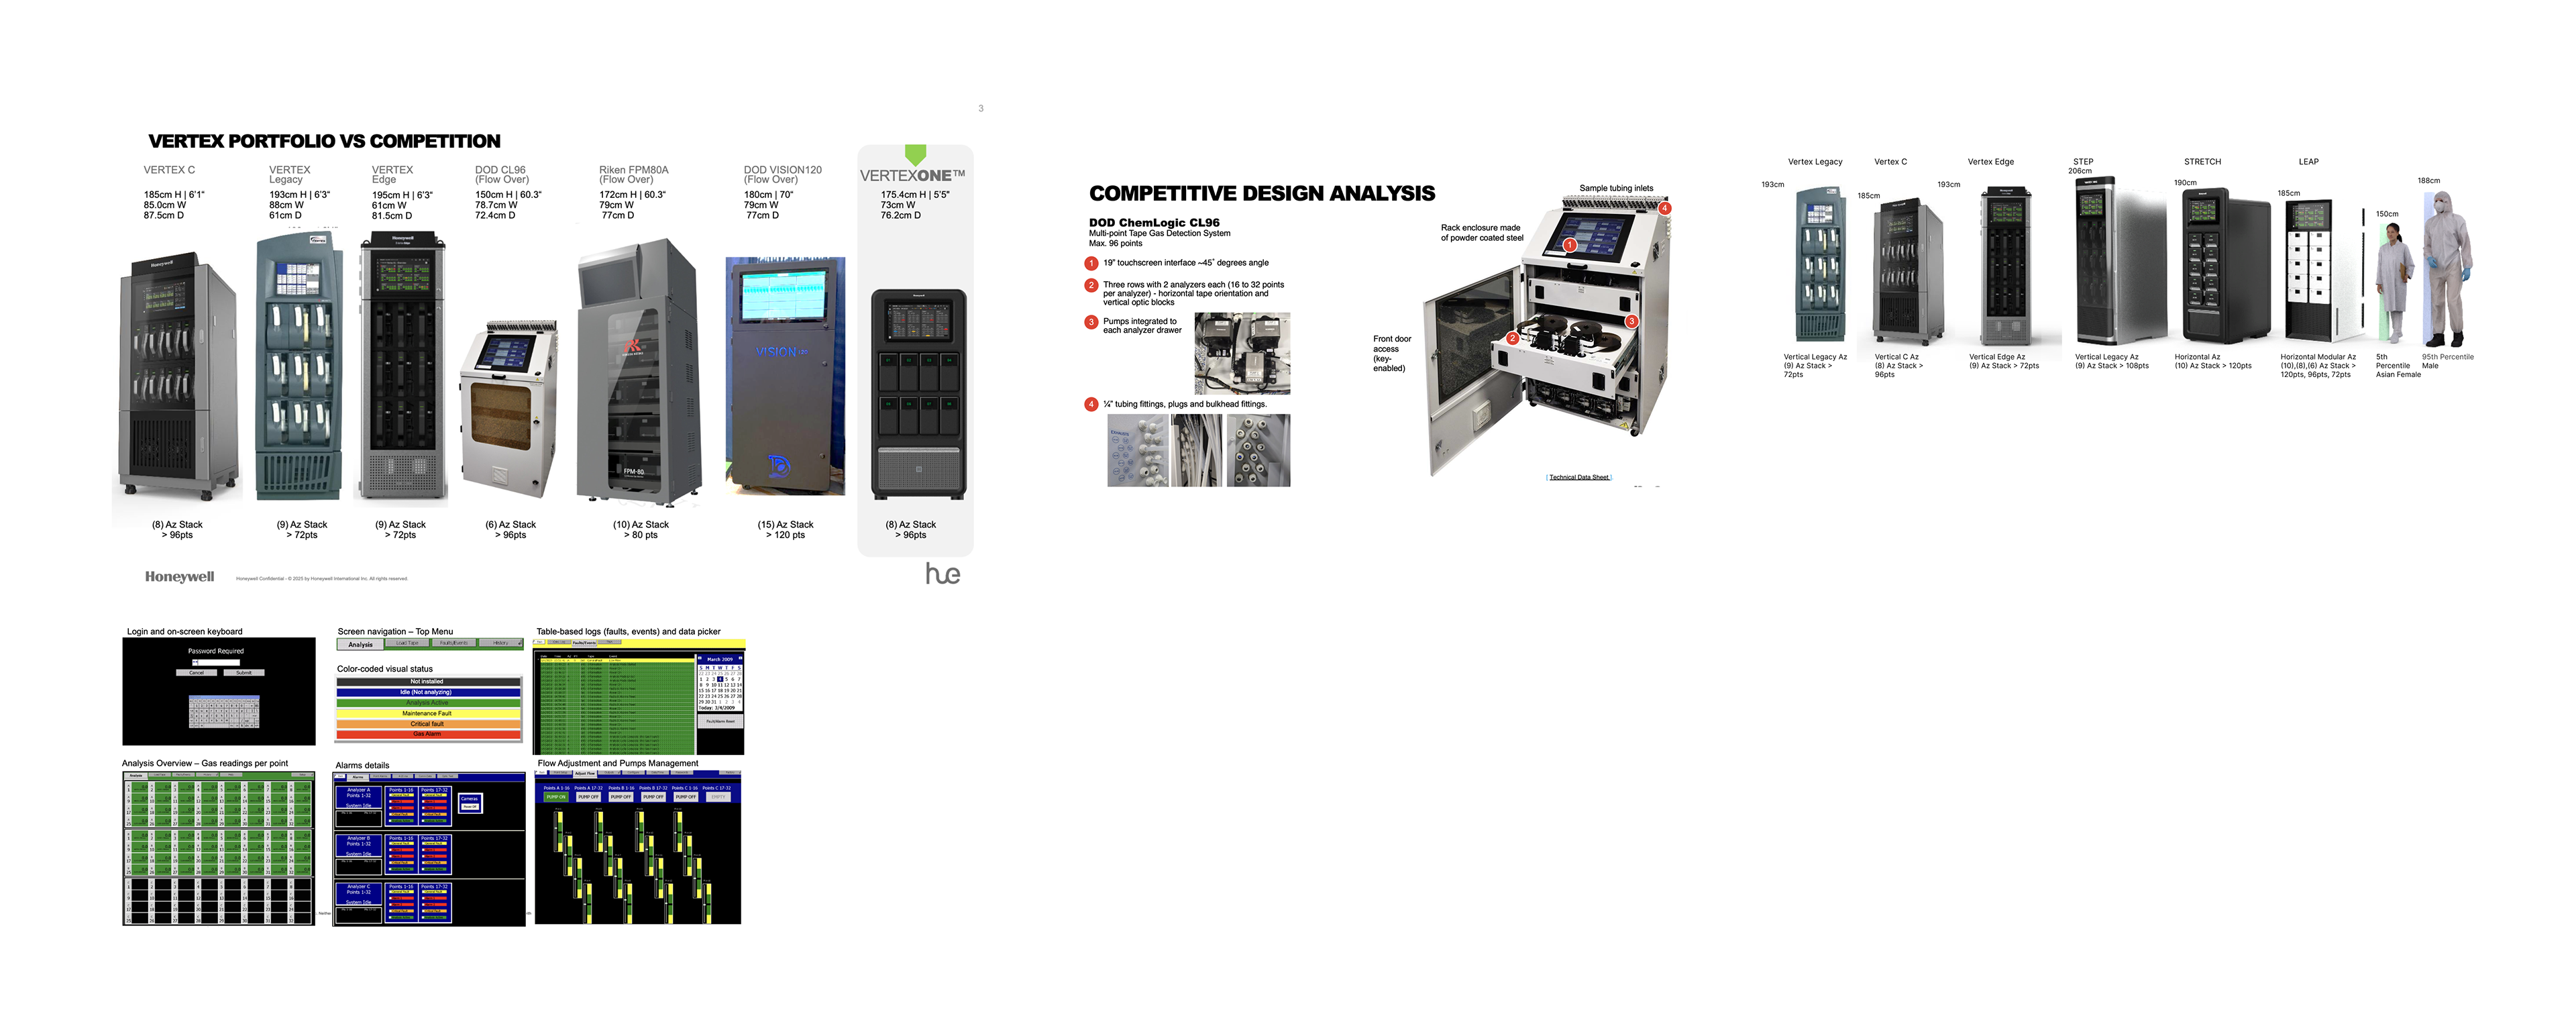
Competitive Analysis
An evaluation of major competitors—such as Riken and DOD—revealed several usability and accessibility issues in their touchscreen interfaces. Poor color contrast, dense information layouts, and small touch targets make competitor screens difficult to operate and visually overwhelming.
Interpreting artifacts
Many artifacts from the engineering team were highly technical and difficult to follow, though ultimately very informative. I analyzed and translated these materials—ranging from specifications and process diagrams to test results—into clear, shareable frameworks and visual summaries. This helped cross-functional partners quickly grasp complex concepts and apply them effectively during design and development discussions.
Screen Analysis
Mapping the legacy Vertex screens helped to make sense of the decades old interface. Ahead of its time, the interface was designed prior to inventions like iPhone and iPad and the advent of touch interfaces. Therefore, trial and error and a reliance on training manuals were prerequisites for usage. Wireframing the legacy interface aided my understanding of the product by removing unnecessary colors. Patterns and a system of thought began to emerge.
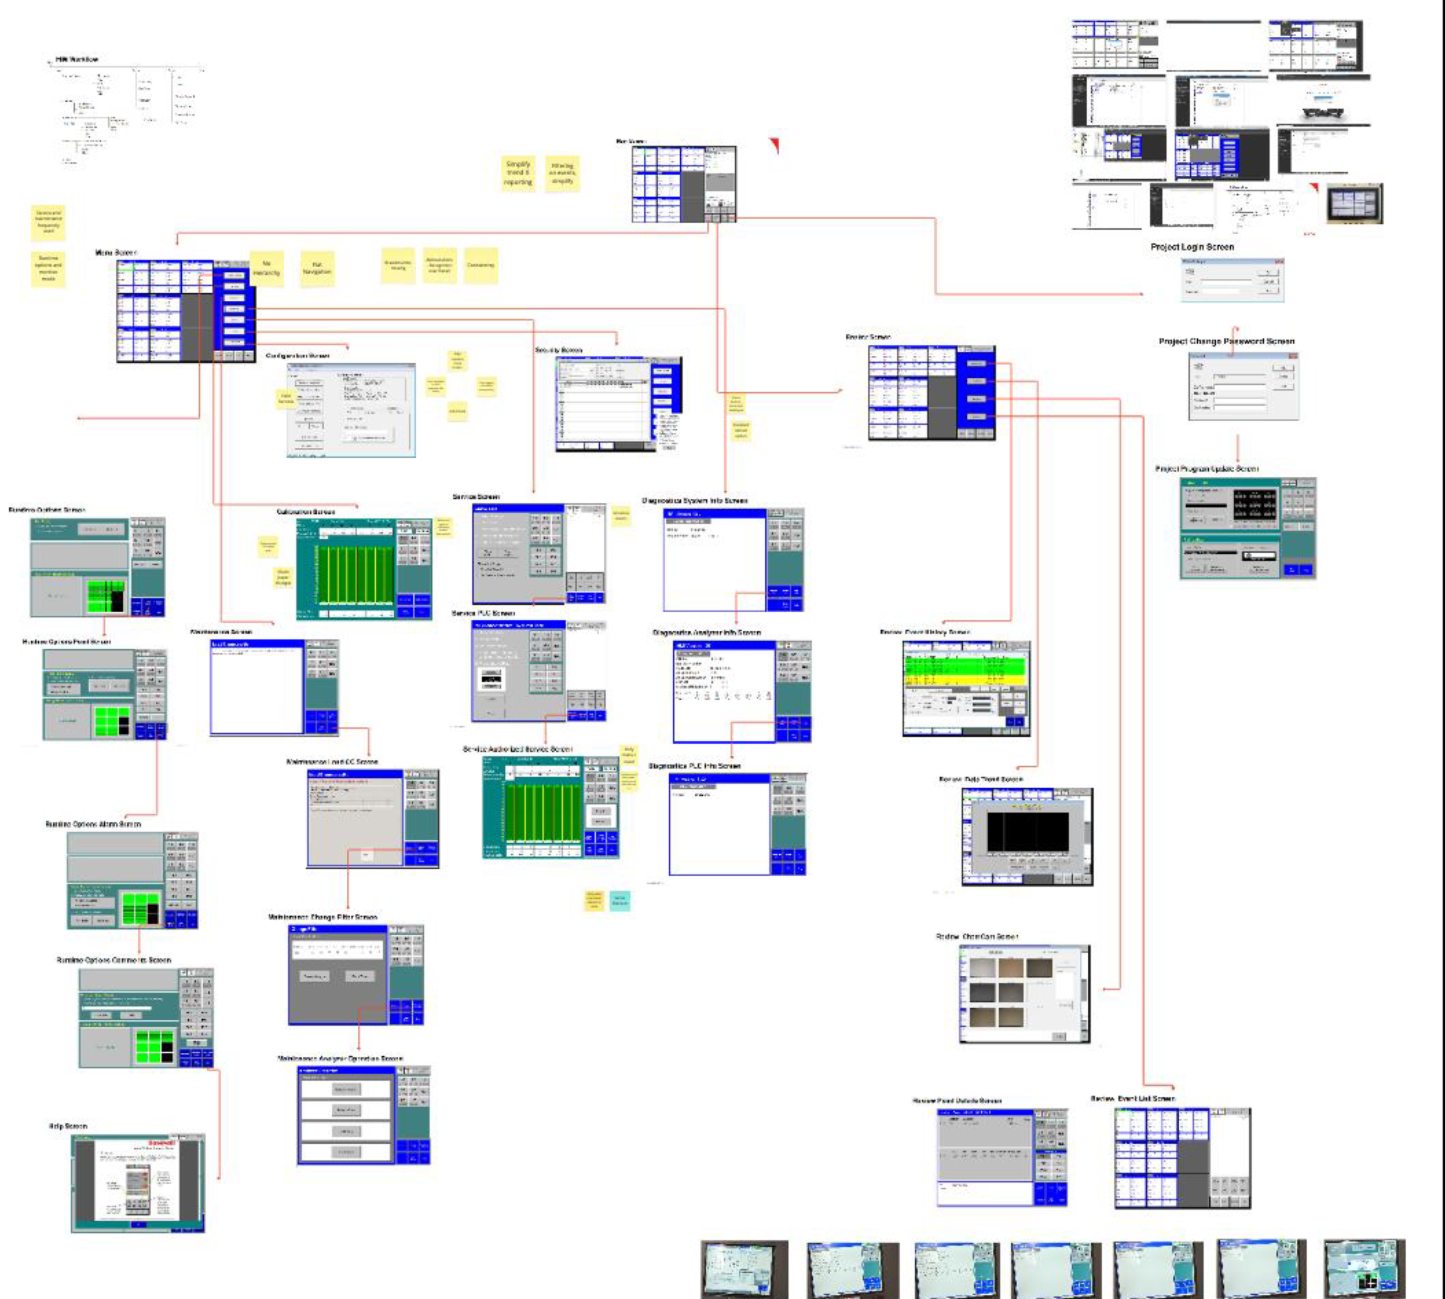
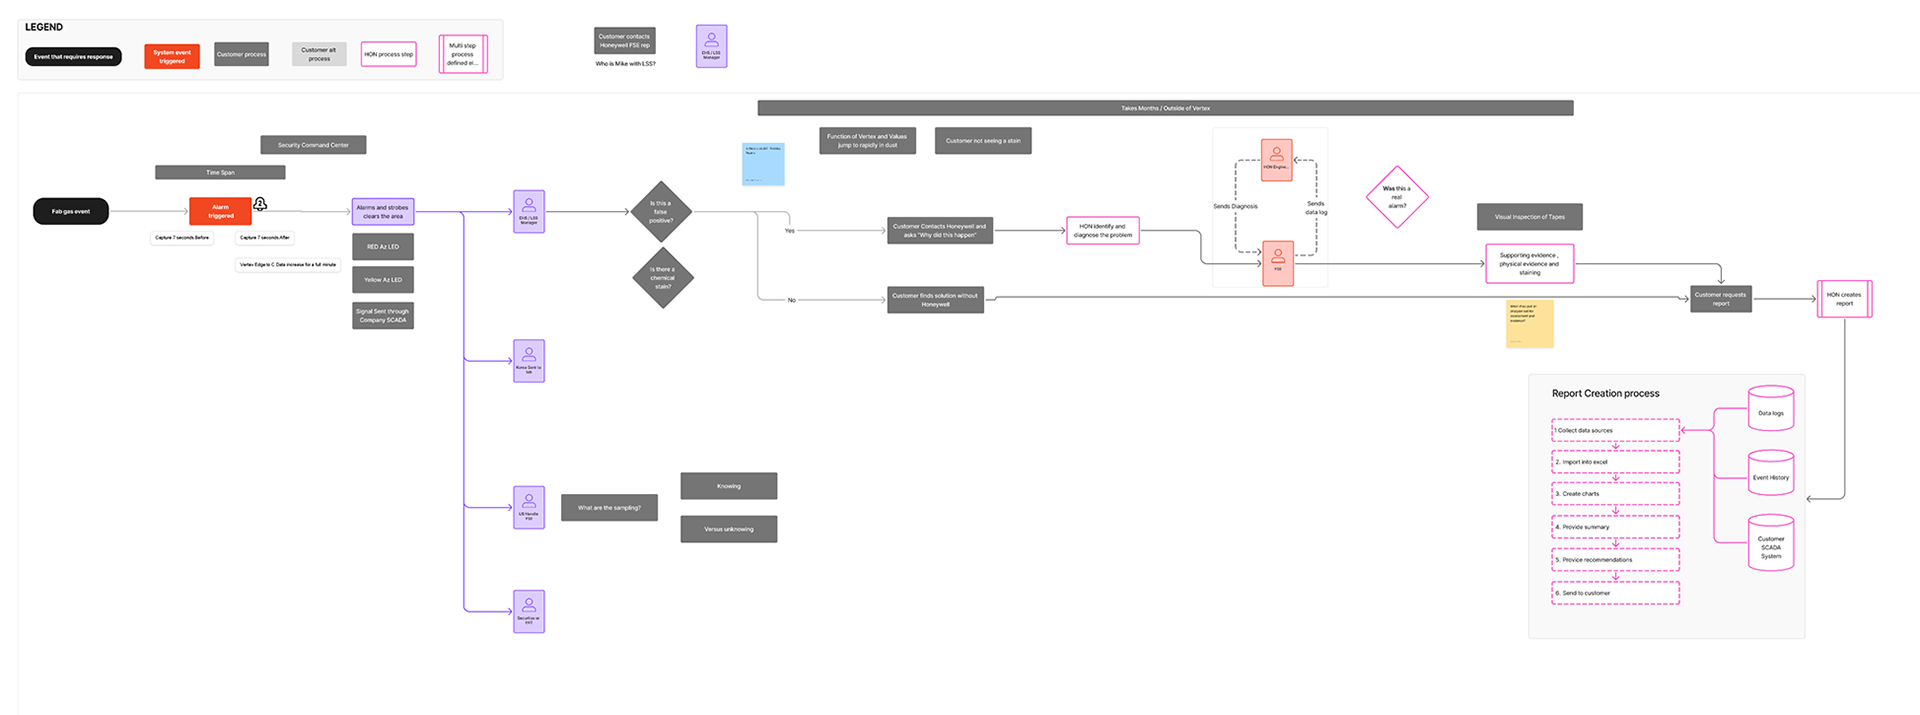
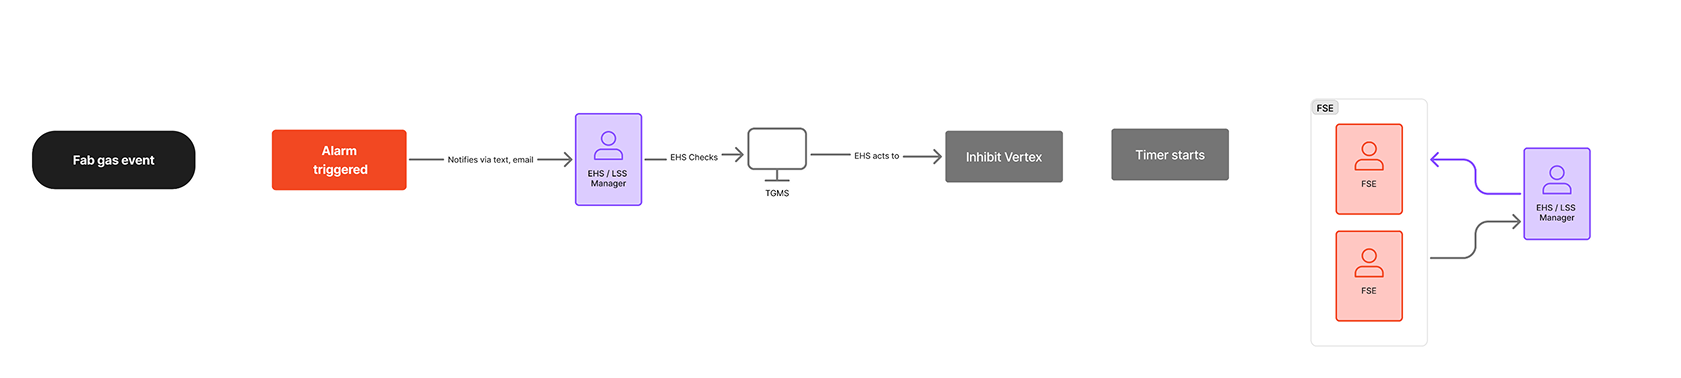
Flows and process documentation
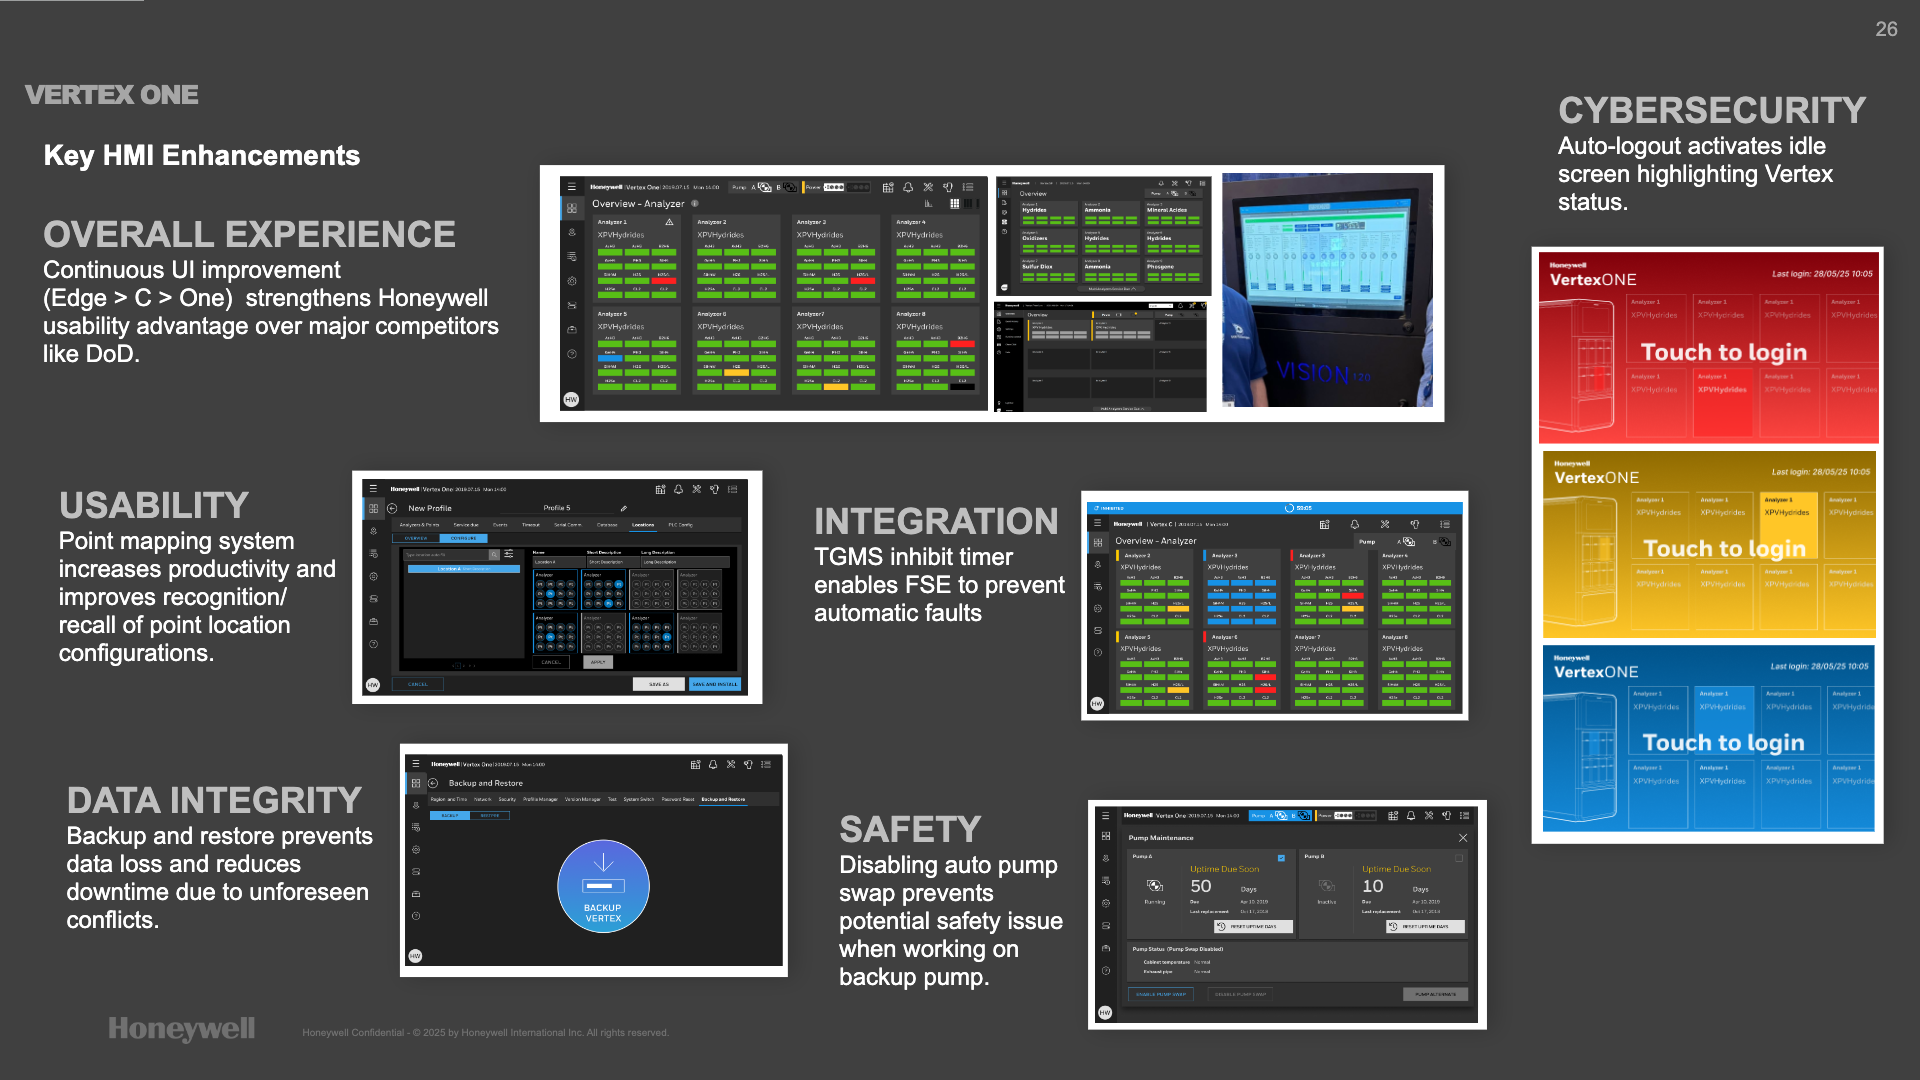
Mapping out flows with field service helped the team to better understand the steps involved when serious issues surrounding gas detection disrupted the FAB. Another key workflow introduced a differentiating feature for disabling auto pump swap and helped stakeholders visualize the functionality.
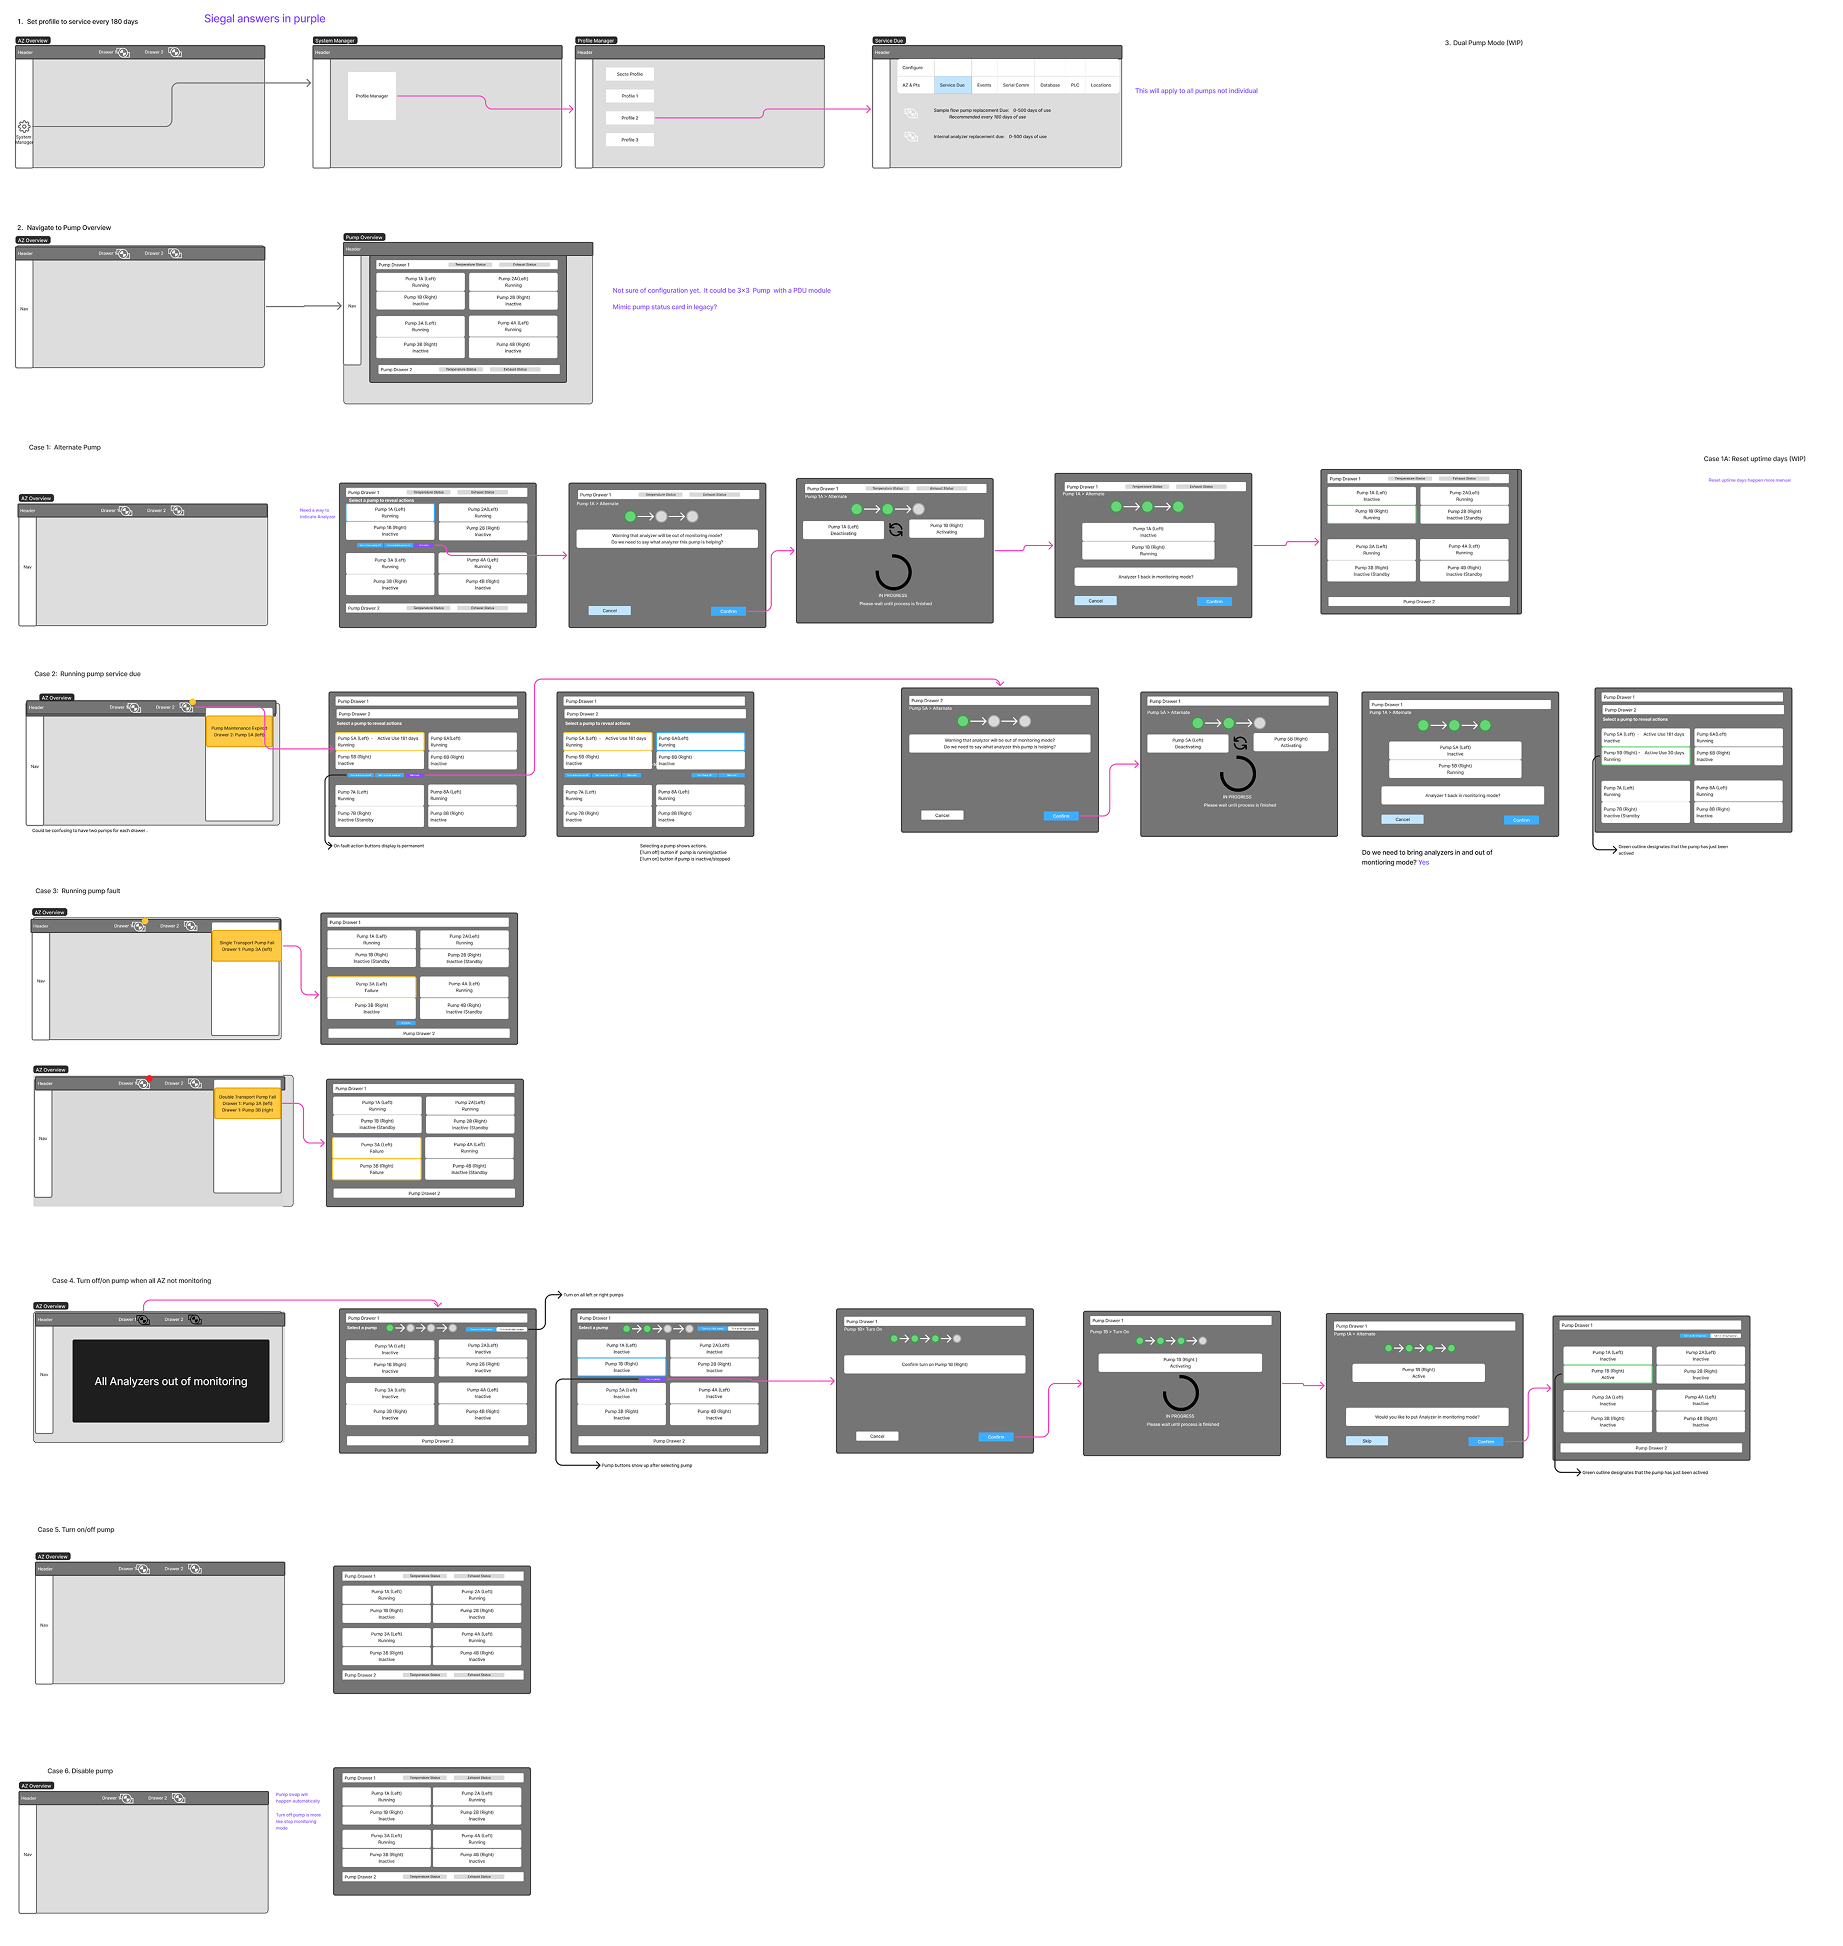
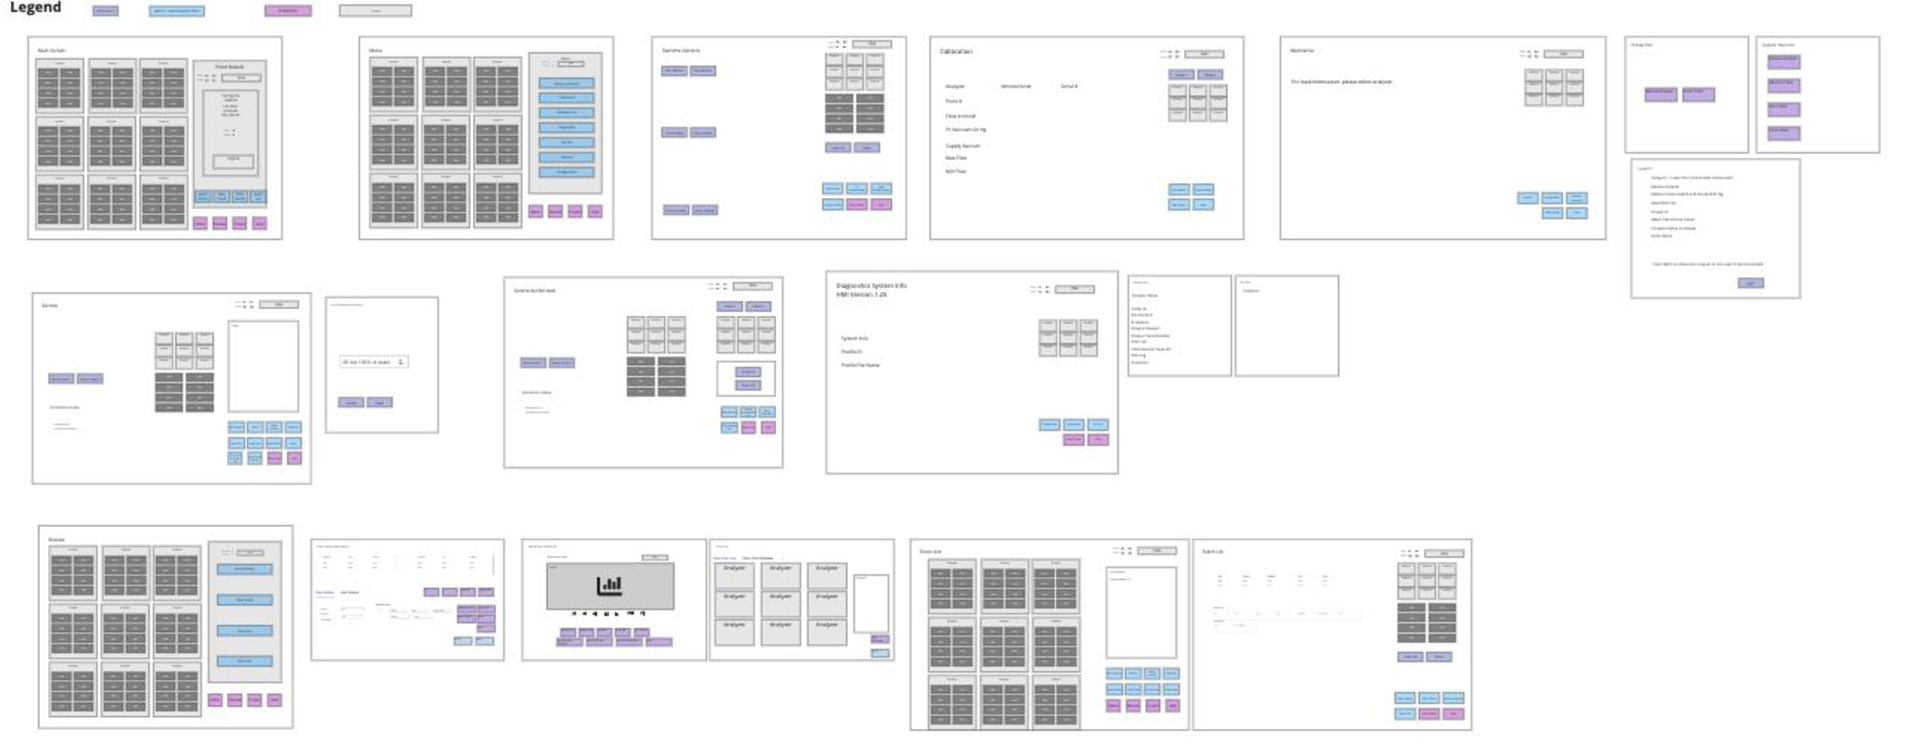
Wireframing
In this case wire framing really helped to reduce the noise on highly complex concepts. The engineers and design team were better able to focus on the process and the placement of key elements as we designed a pump maintenance system.
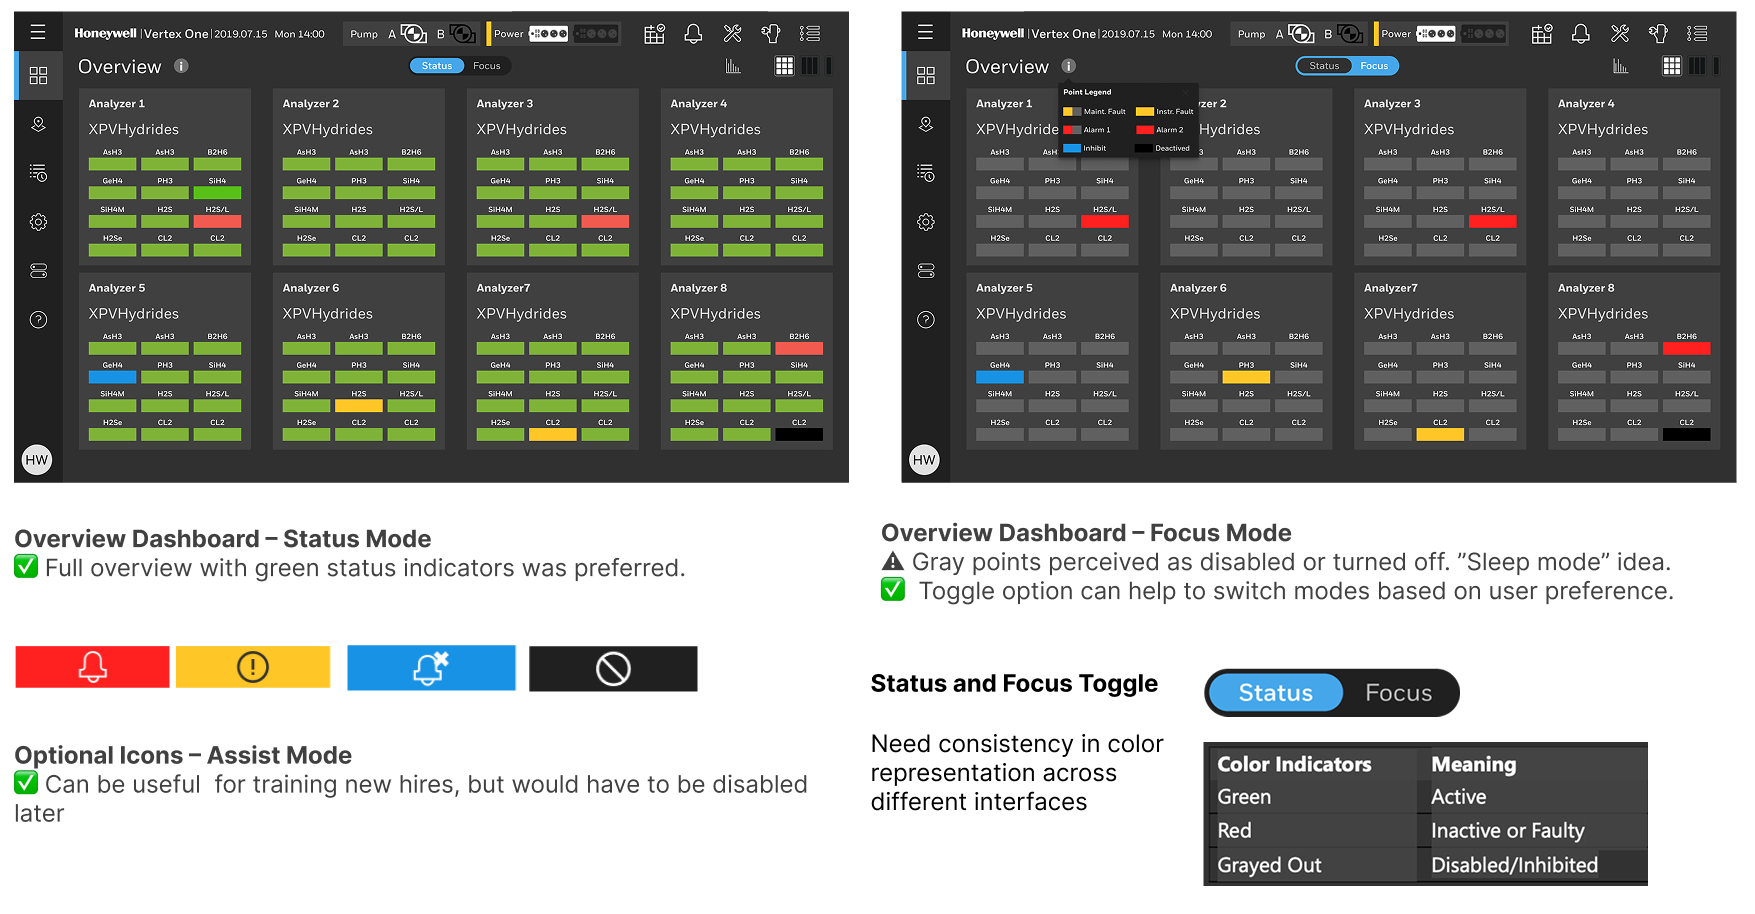
Usability testing with customers and internal stakeholders
As initial concepts crystalized the team, consisting of ID, research and UX, wanted to test out the validity with customer and stakeholders. Through this process we discovered that seeing green is calming and that focus mode color palette can mean something different within the staff at the fab. We tested step-by-step guidance, and the value of an AI assistant, all of which yielded surprising results. Lastly we wanted to test the value of analytics and how the visualization would be more valuable than the current table based event history.
Finalizing Design Screens
After thoroughly and meticulously researching the new Vertex UI, synthesizing and theming the result. After the interviews, VOC, usability studies, protoypes and wireframing ... only then am I ready for finalizing the user interface. This feels like the easy part after all of the preparation. My method is for user interface design relies on research, screen comparisons, and brand considerations. I want to use the latest design system that the Vertex seems modern and there is also special consideration for the touch screen nature of the HMI and the fact that people may be looking up at the interface. I considered alarms, complicated maintenance scenarios and the latest trends in AI and digital twins.
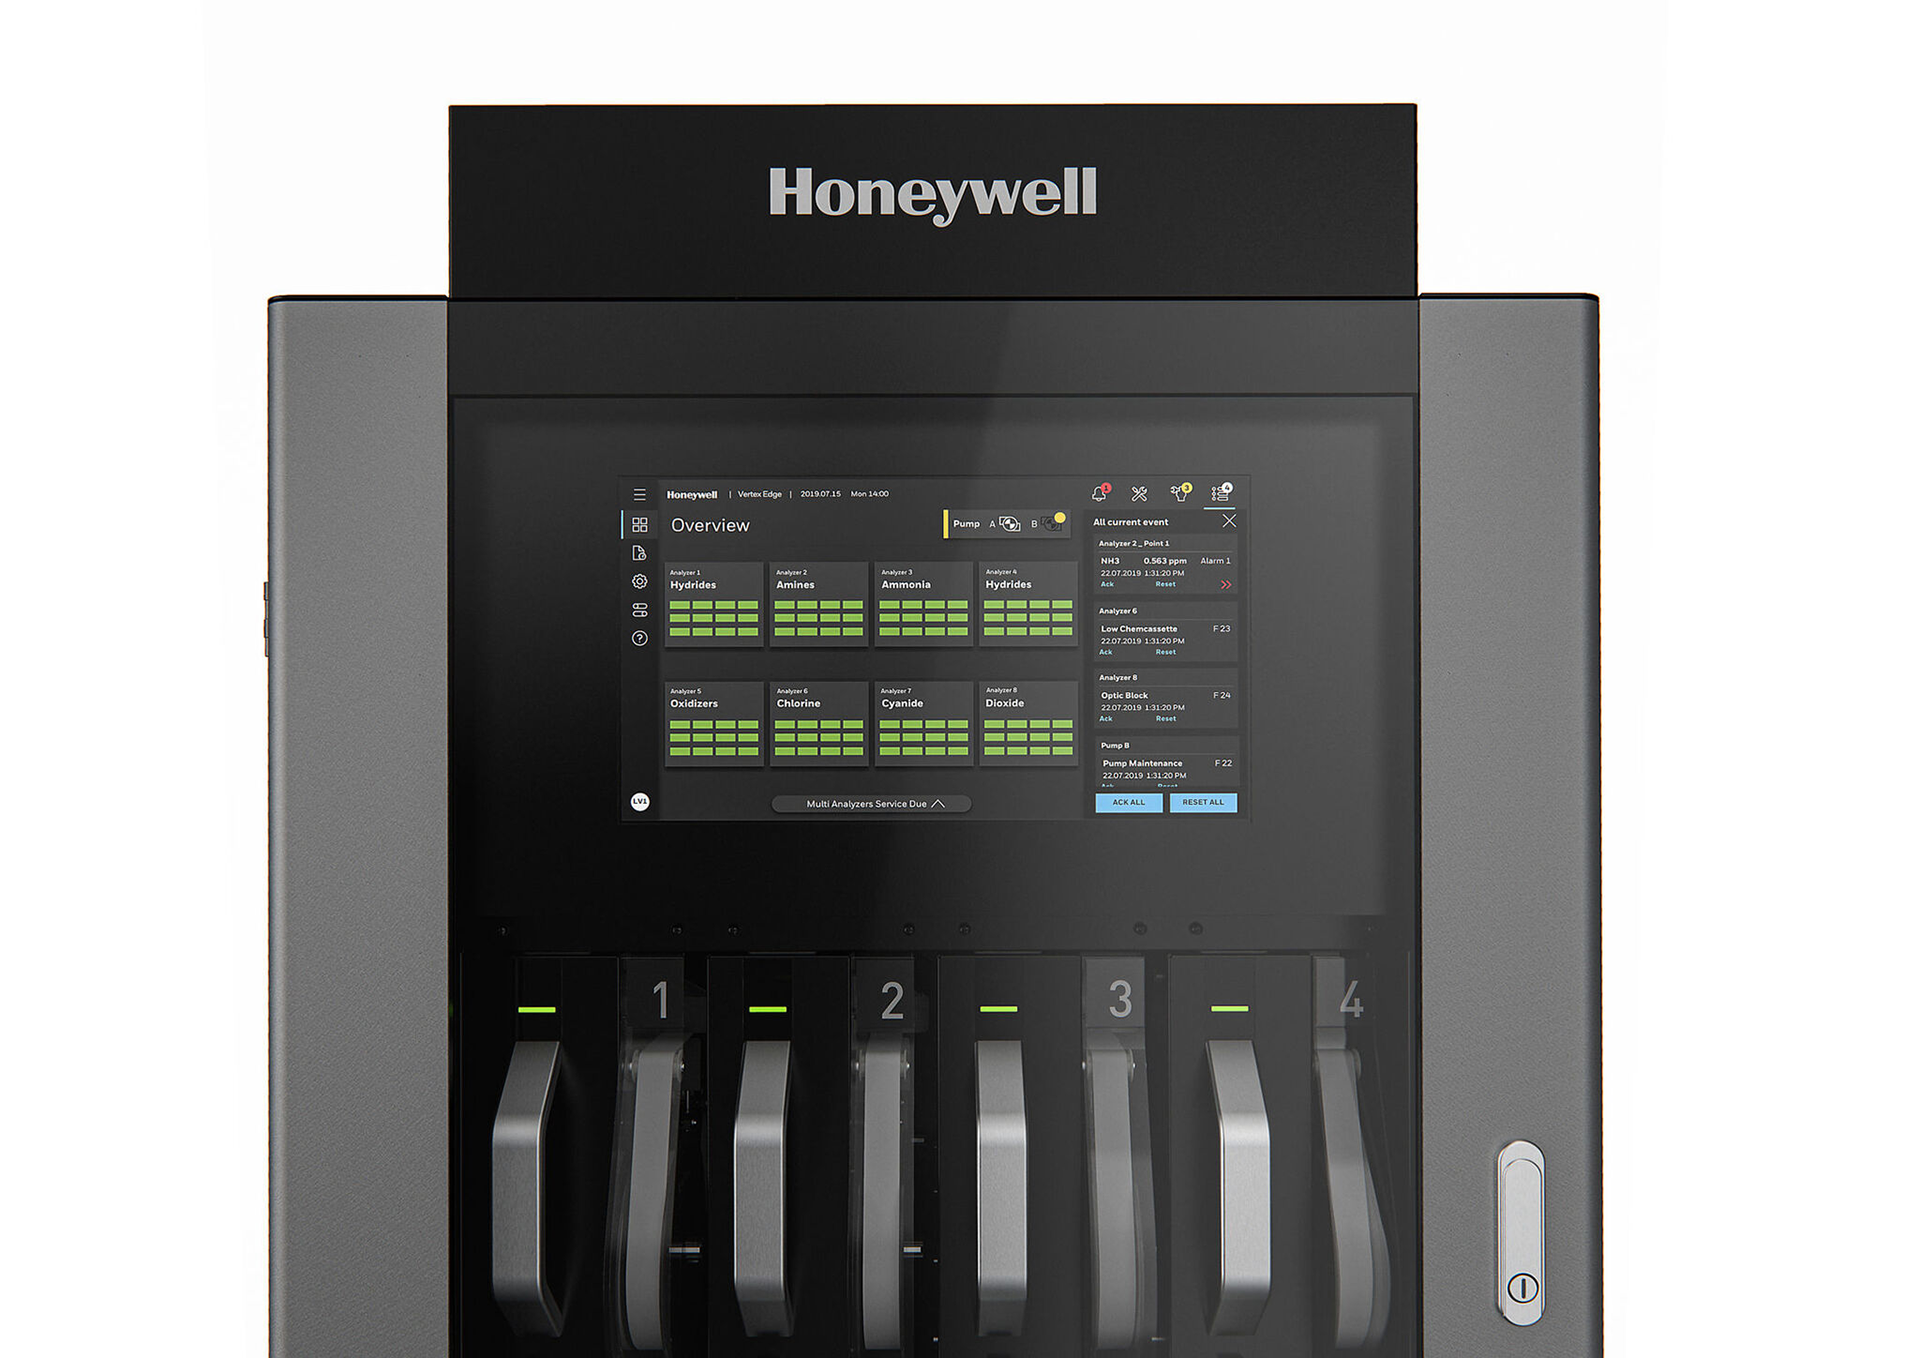
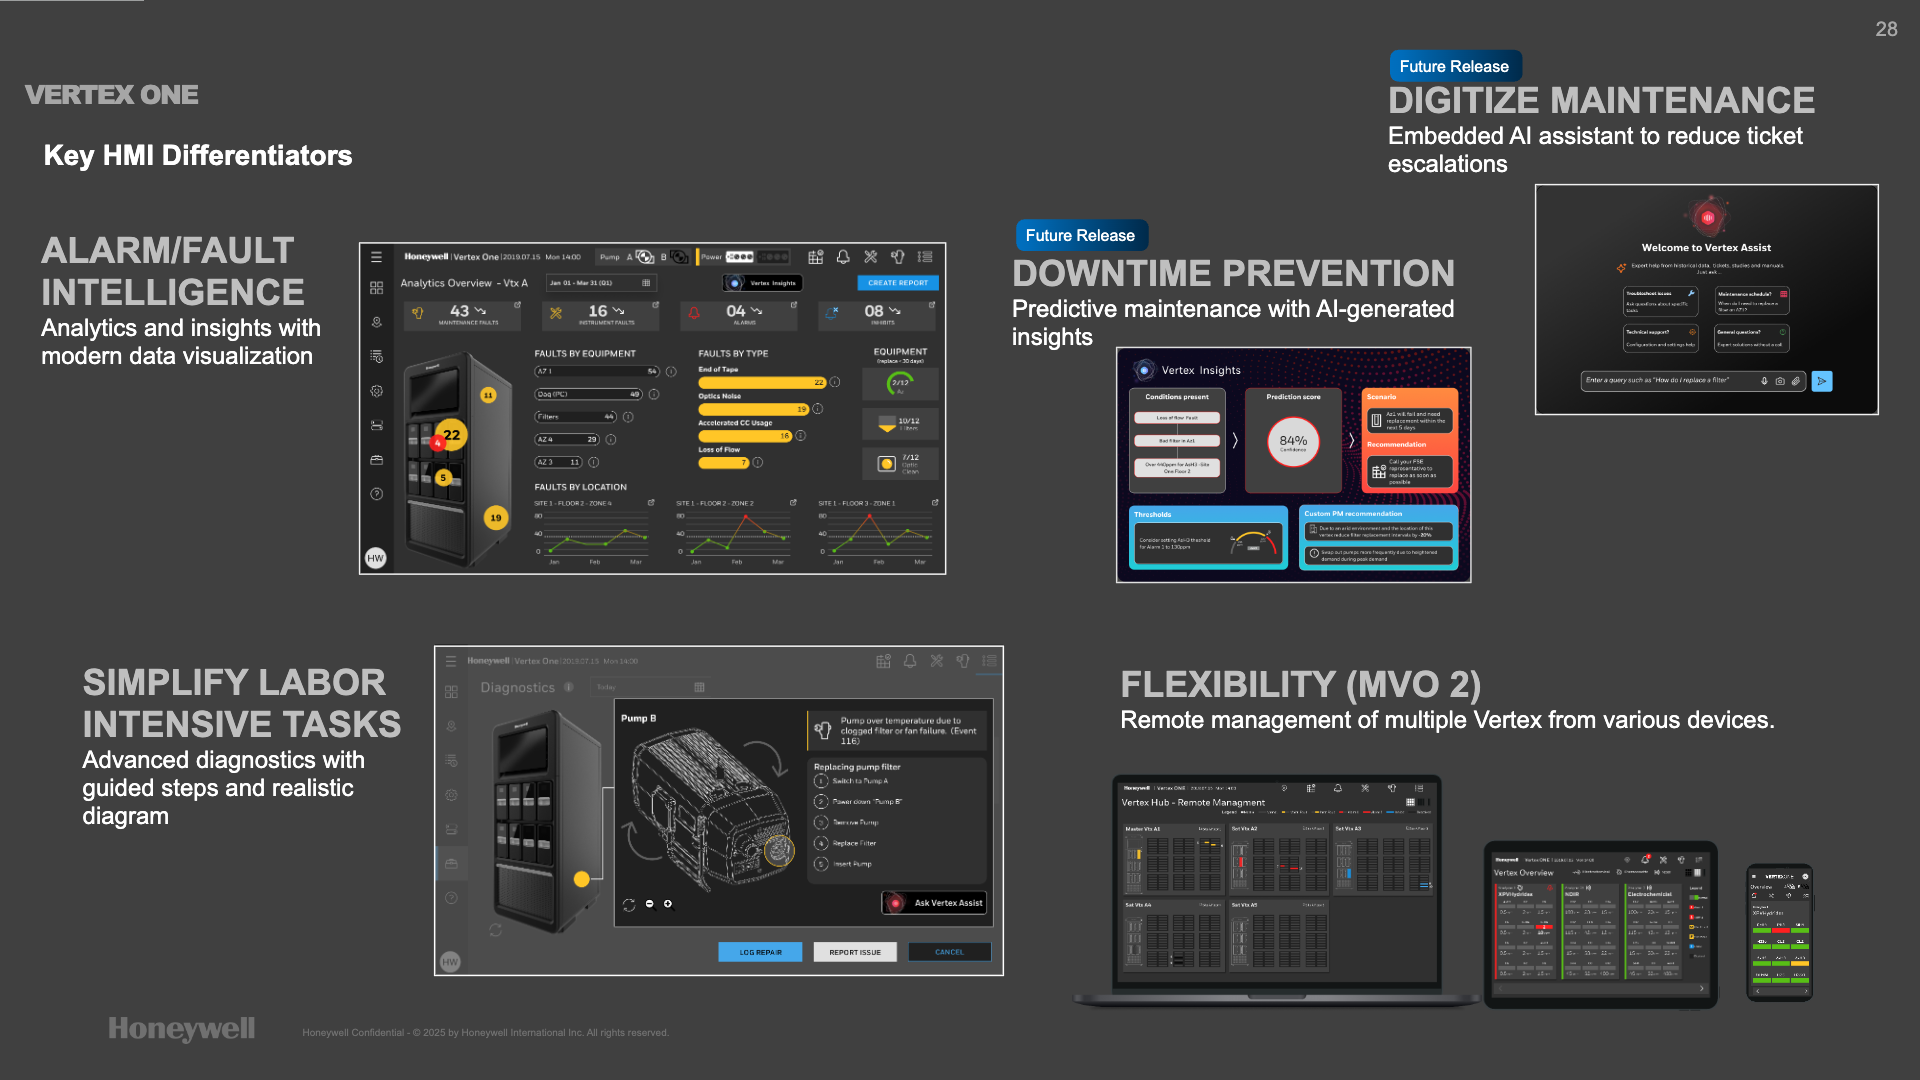
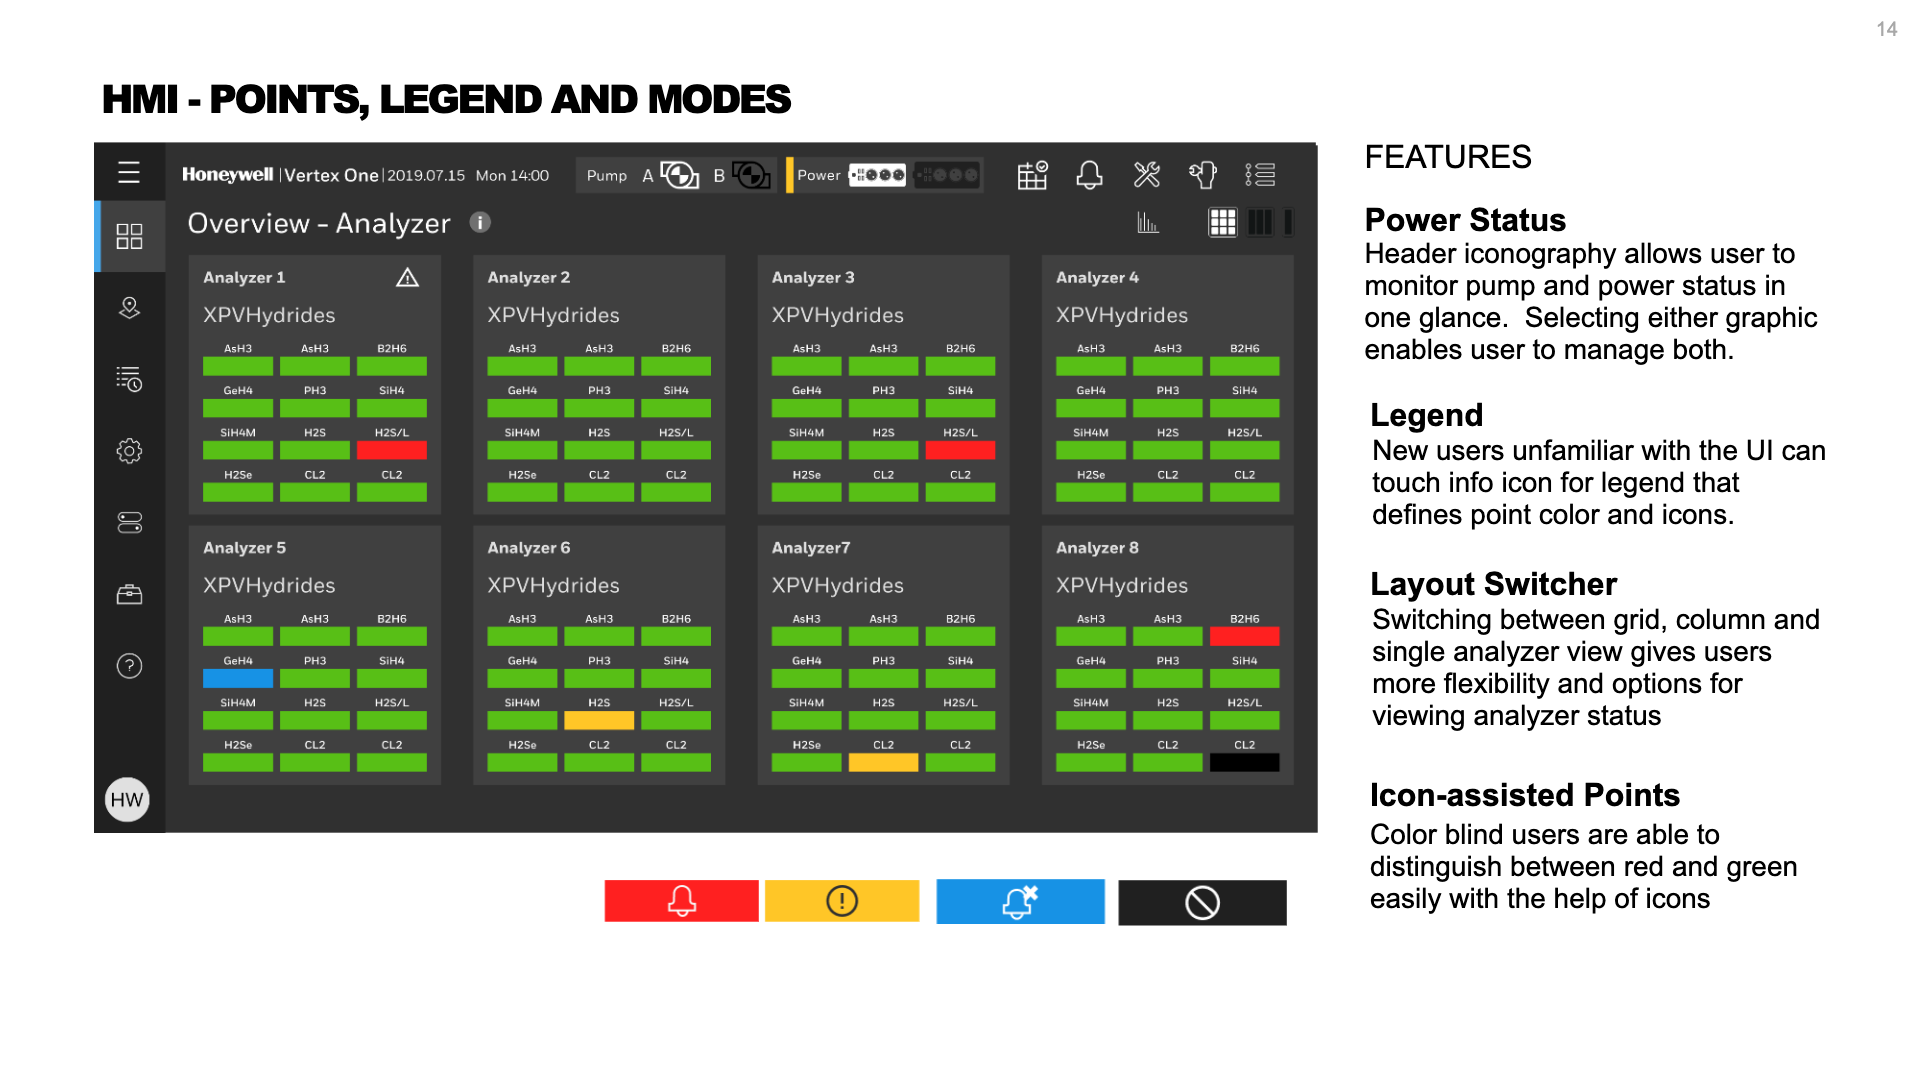
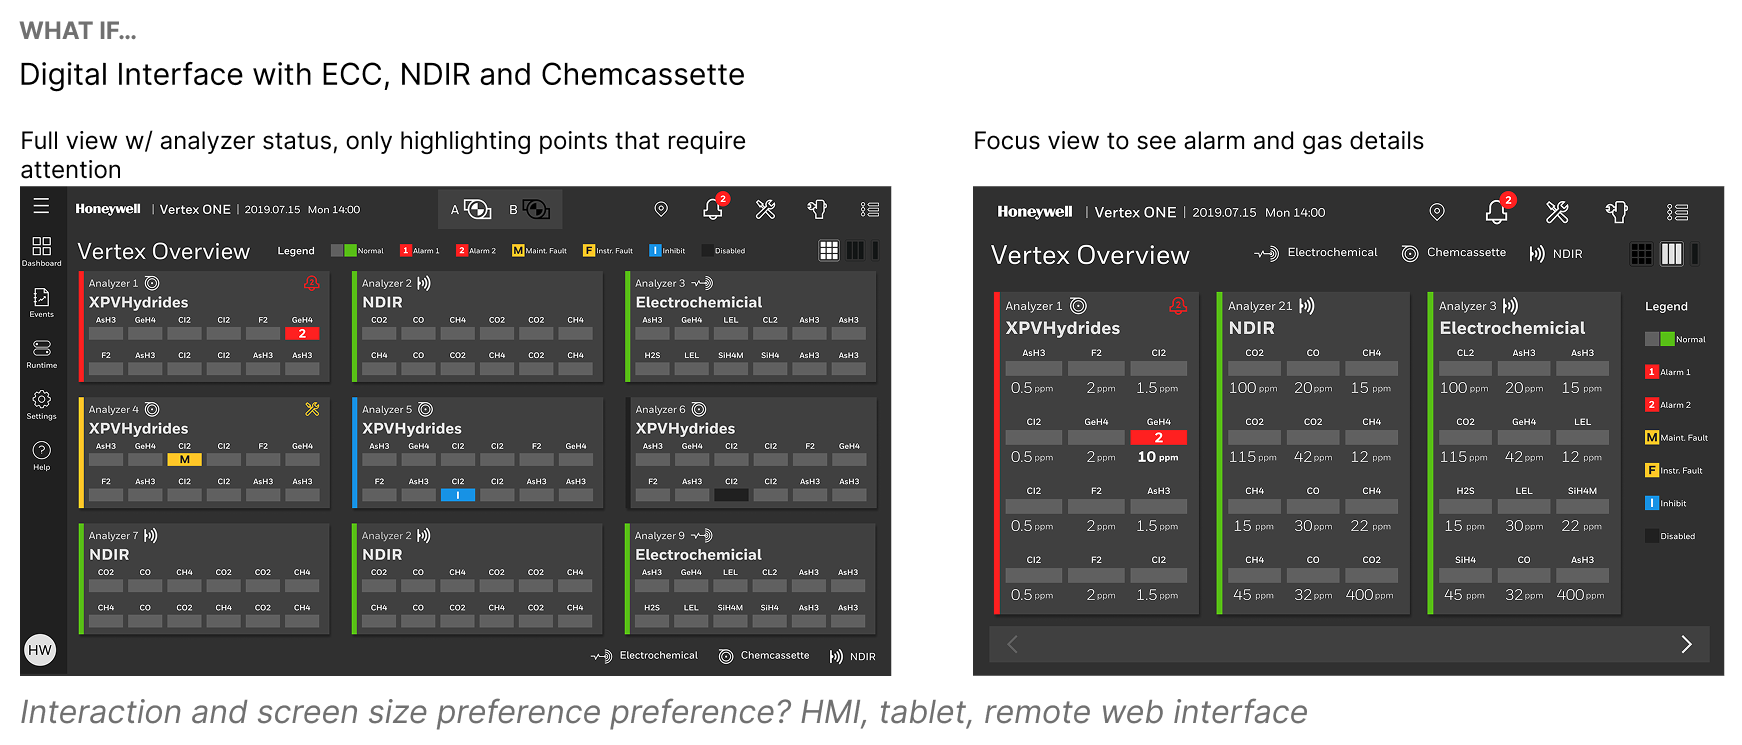
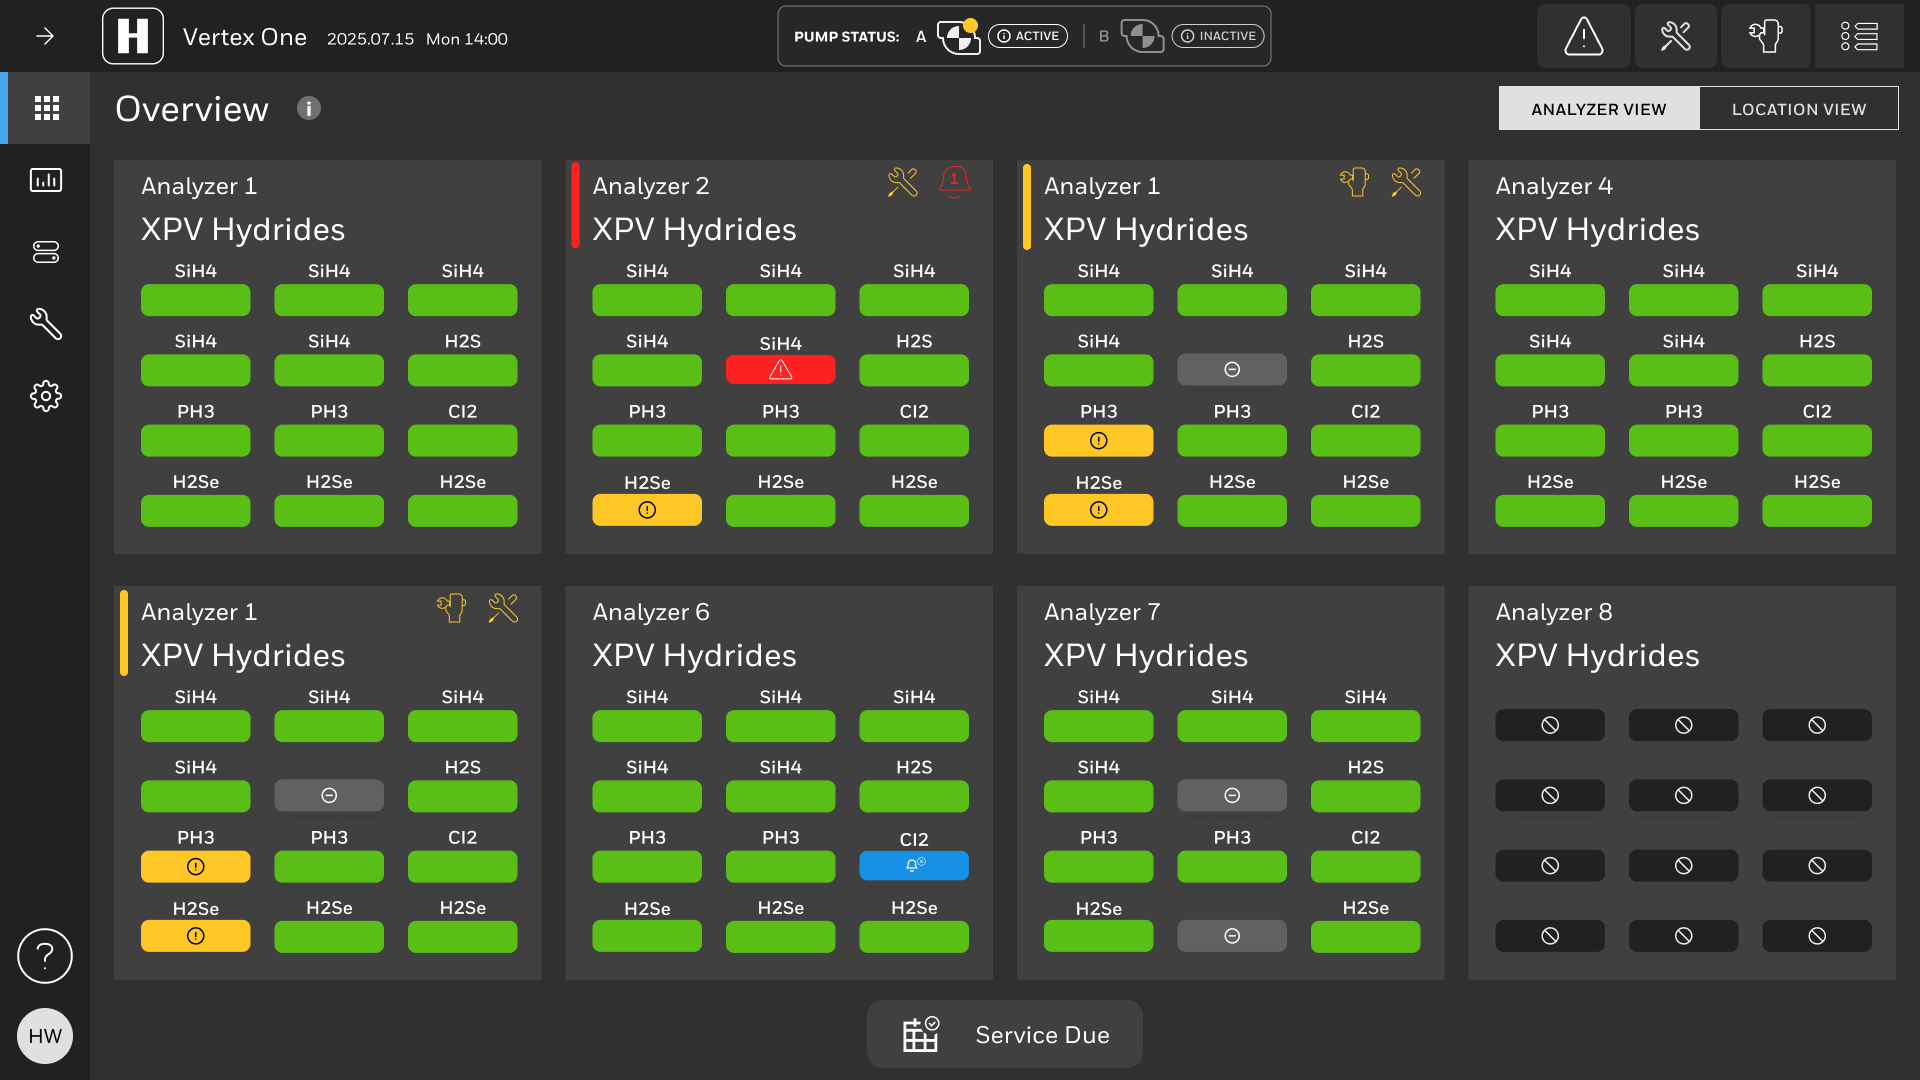
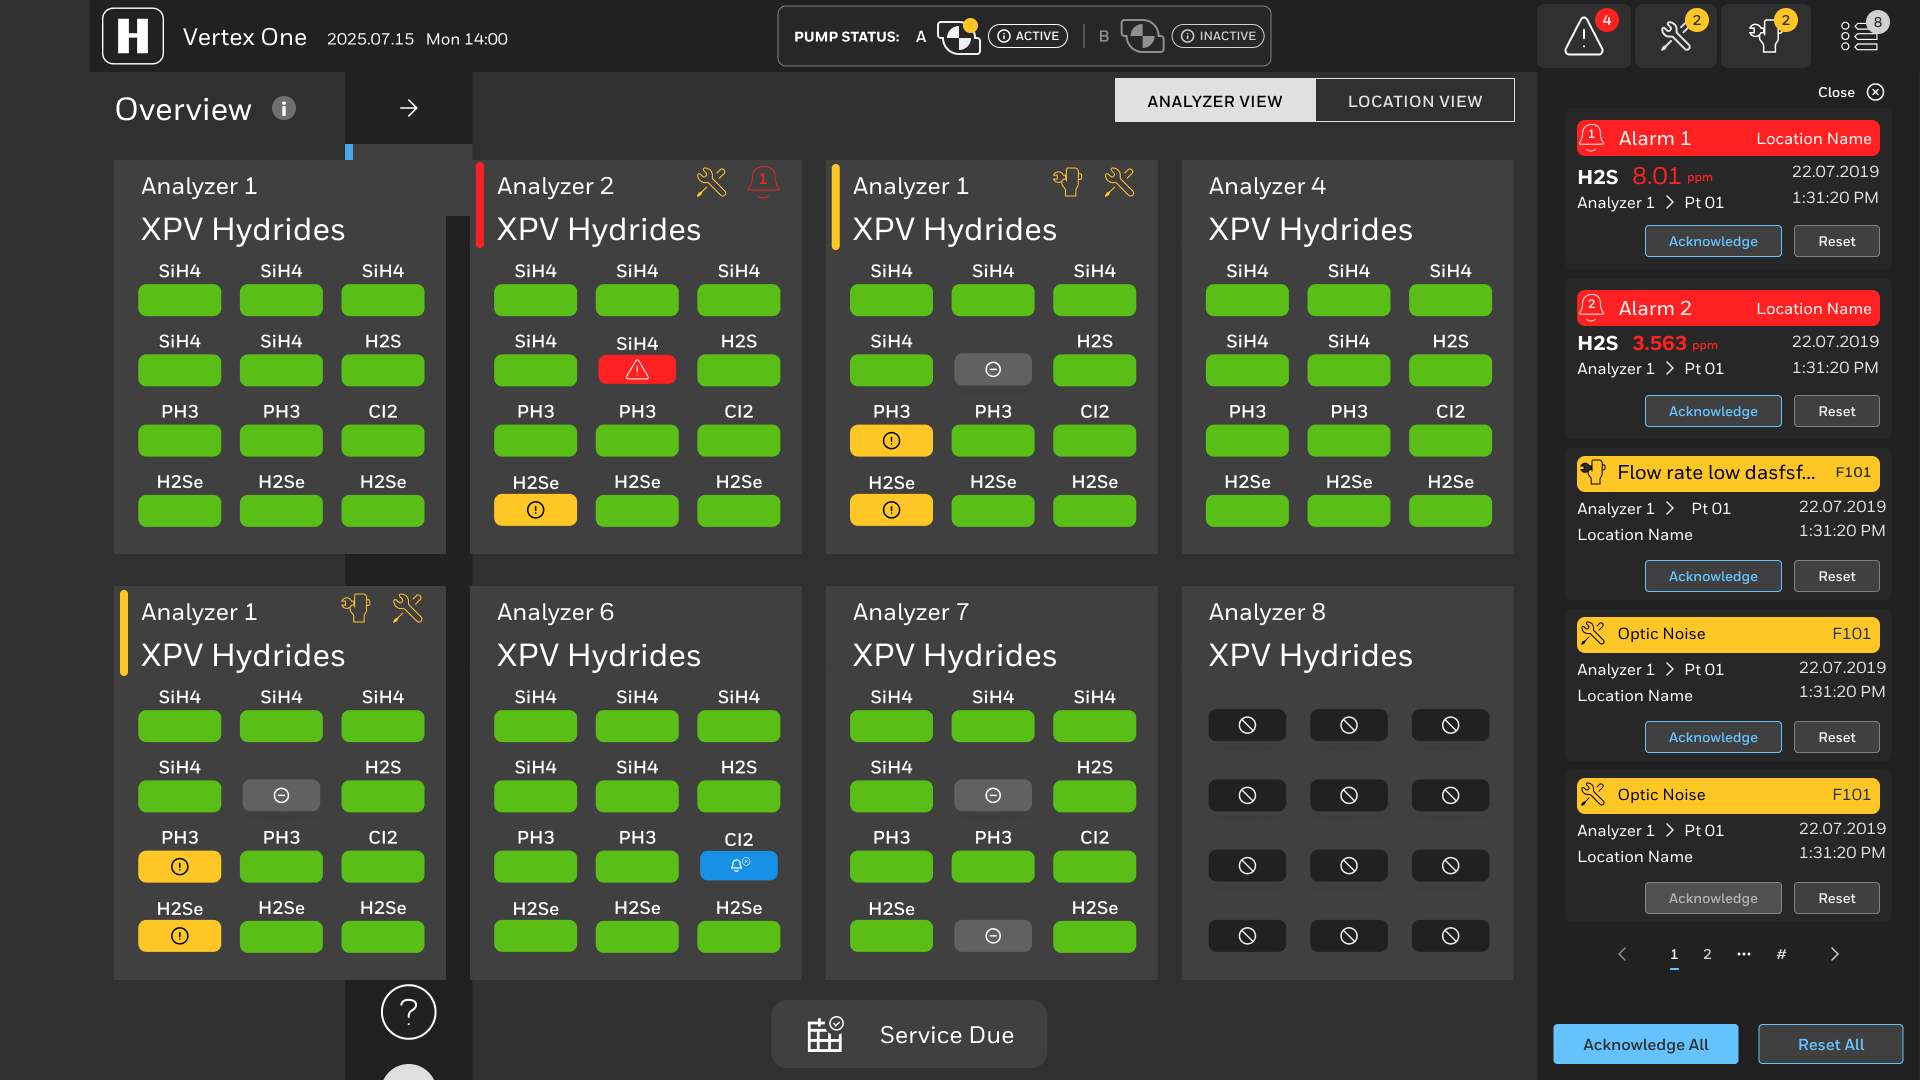
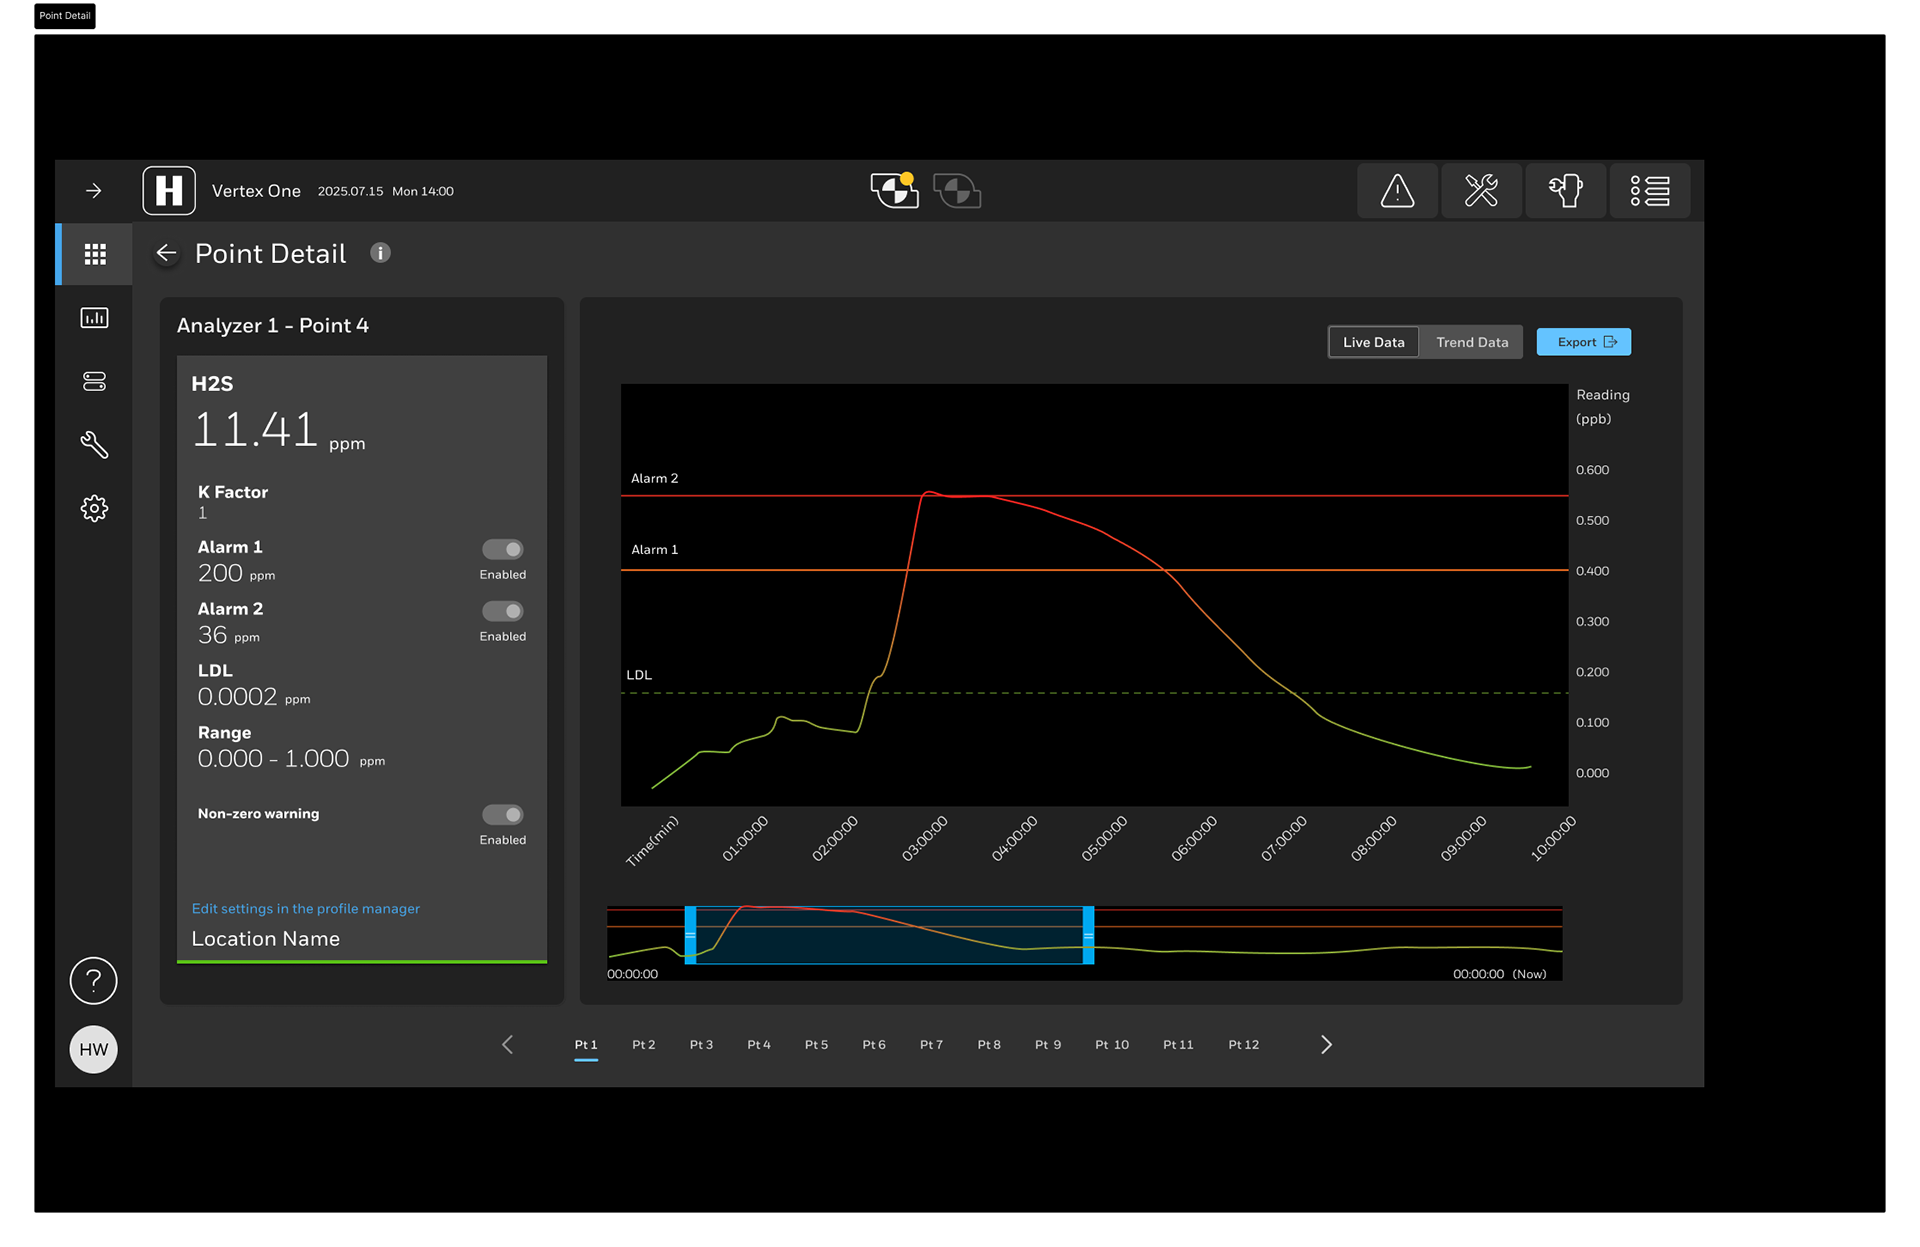
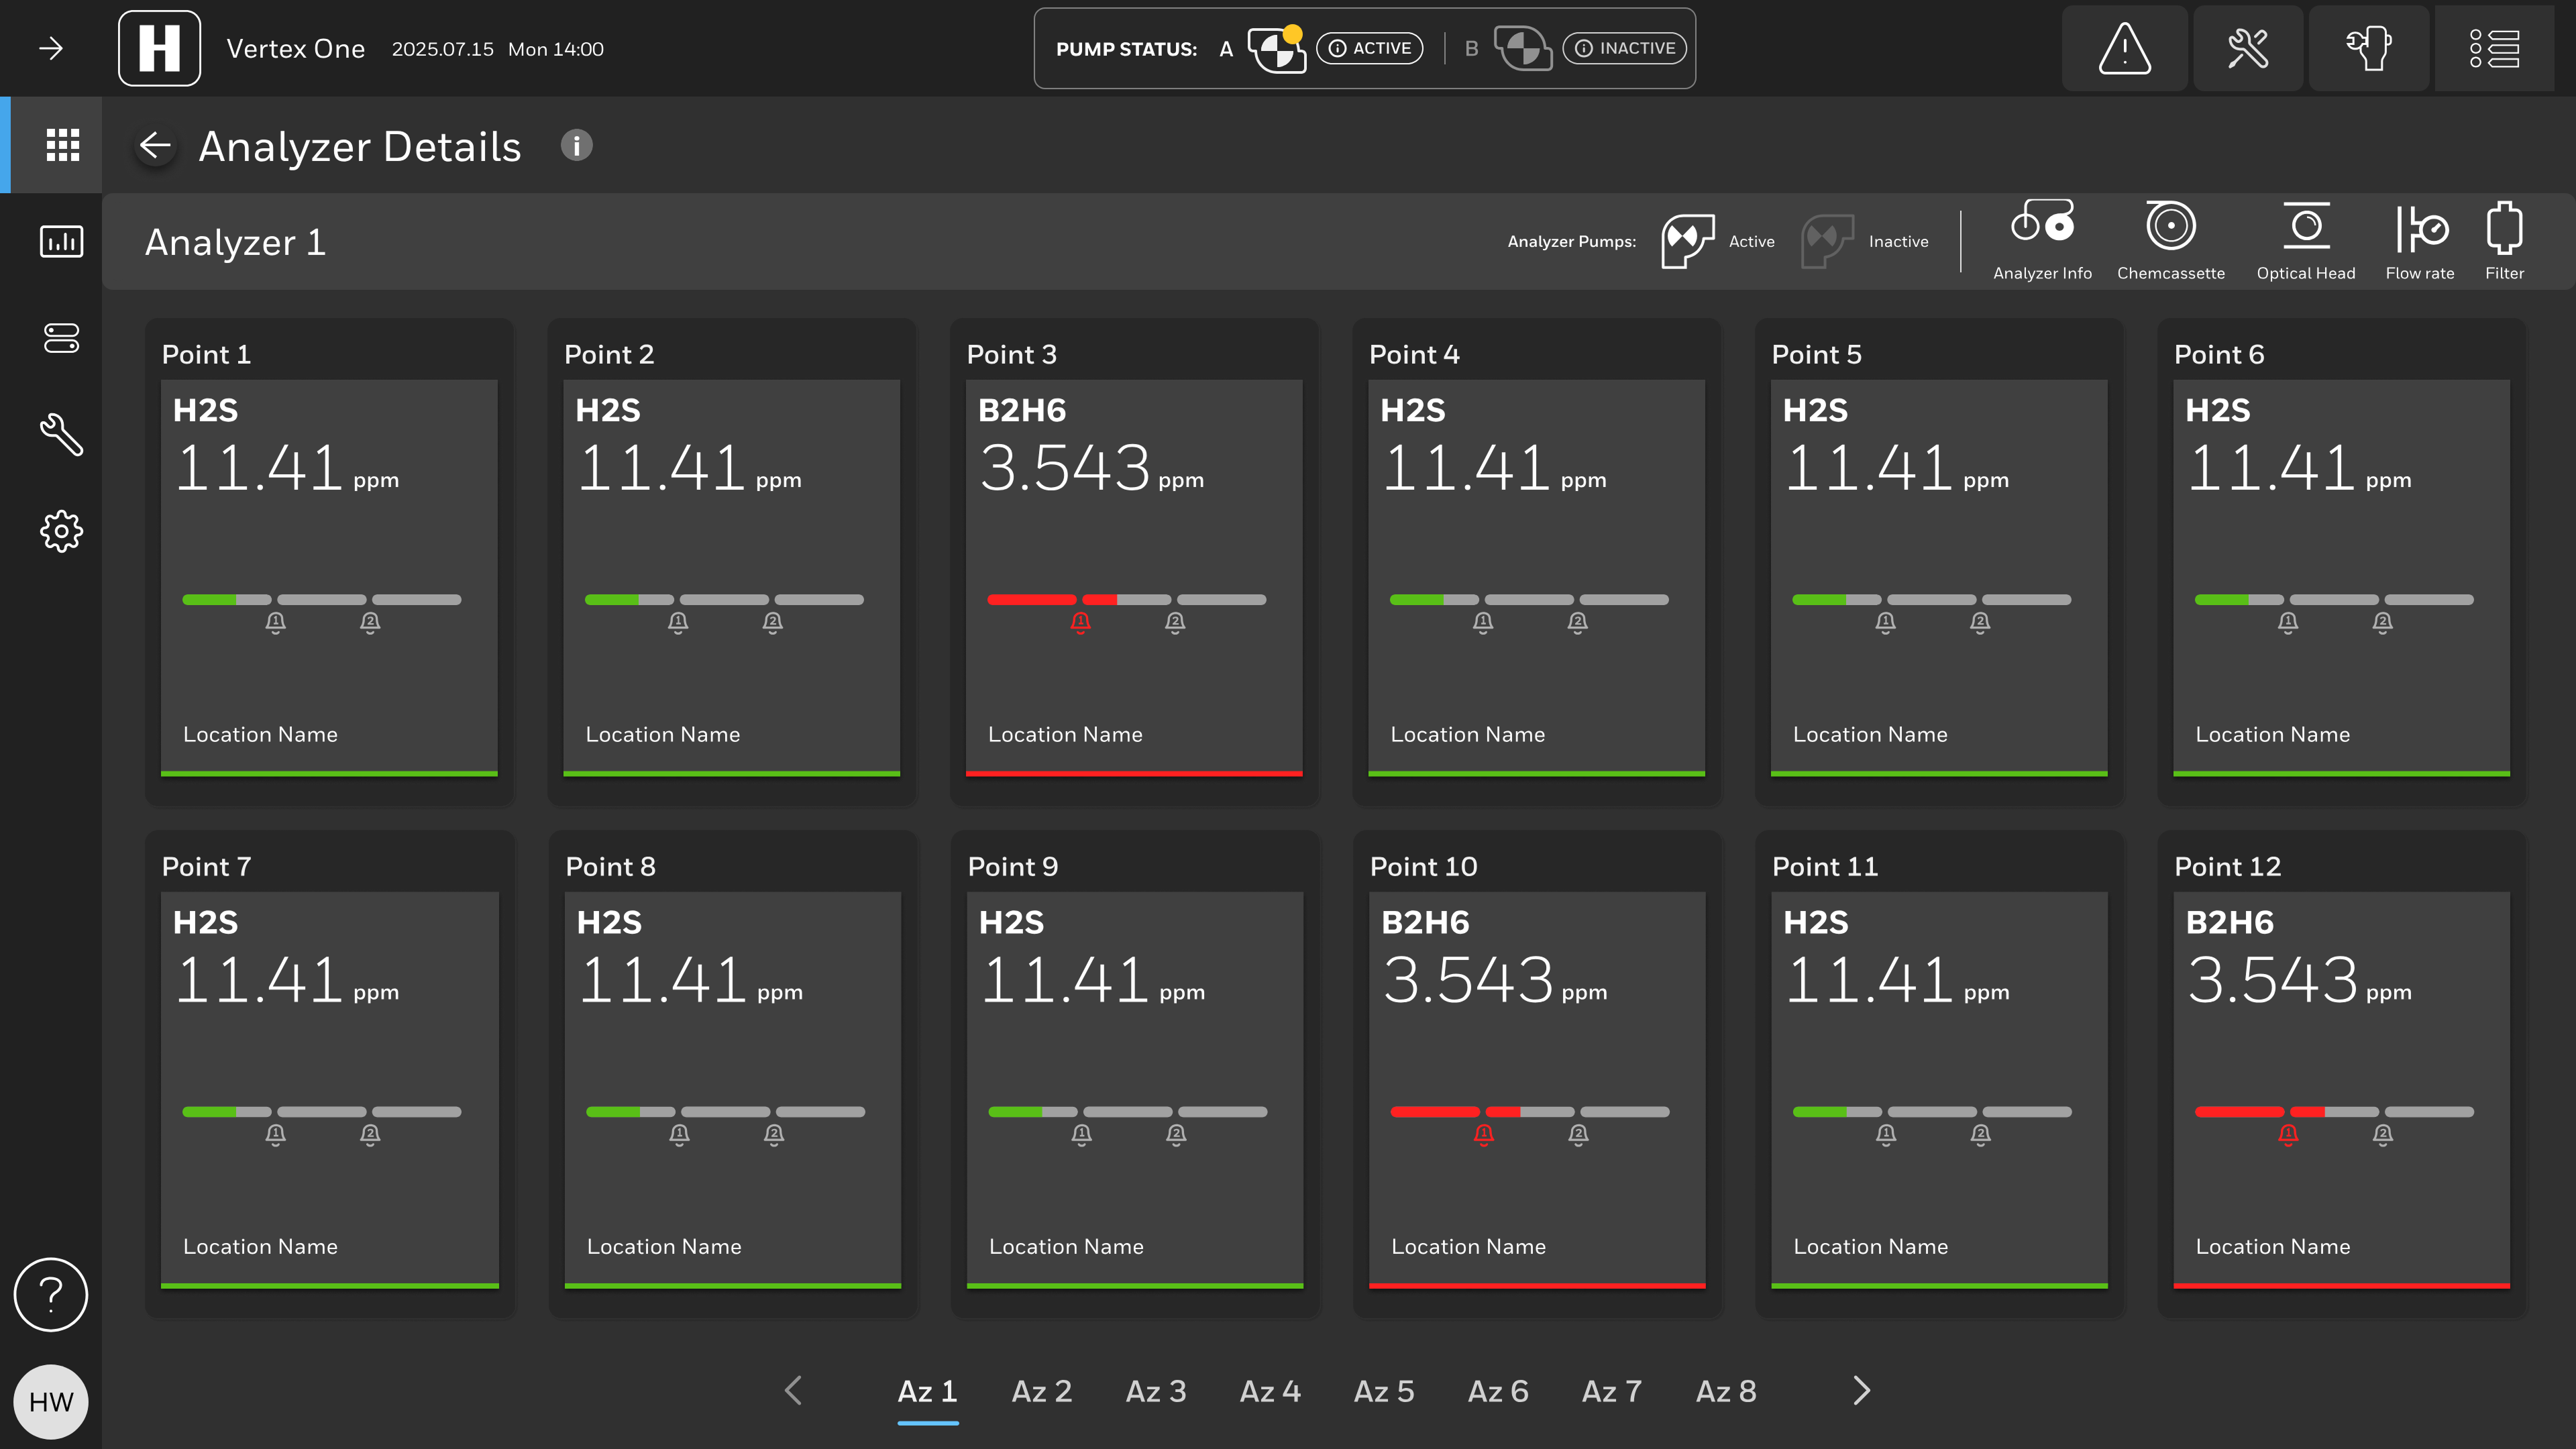
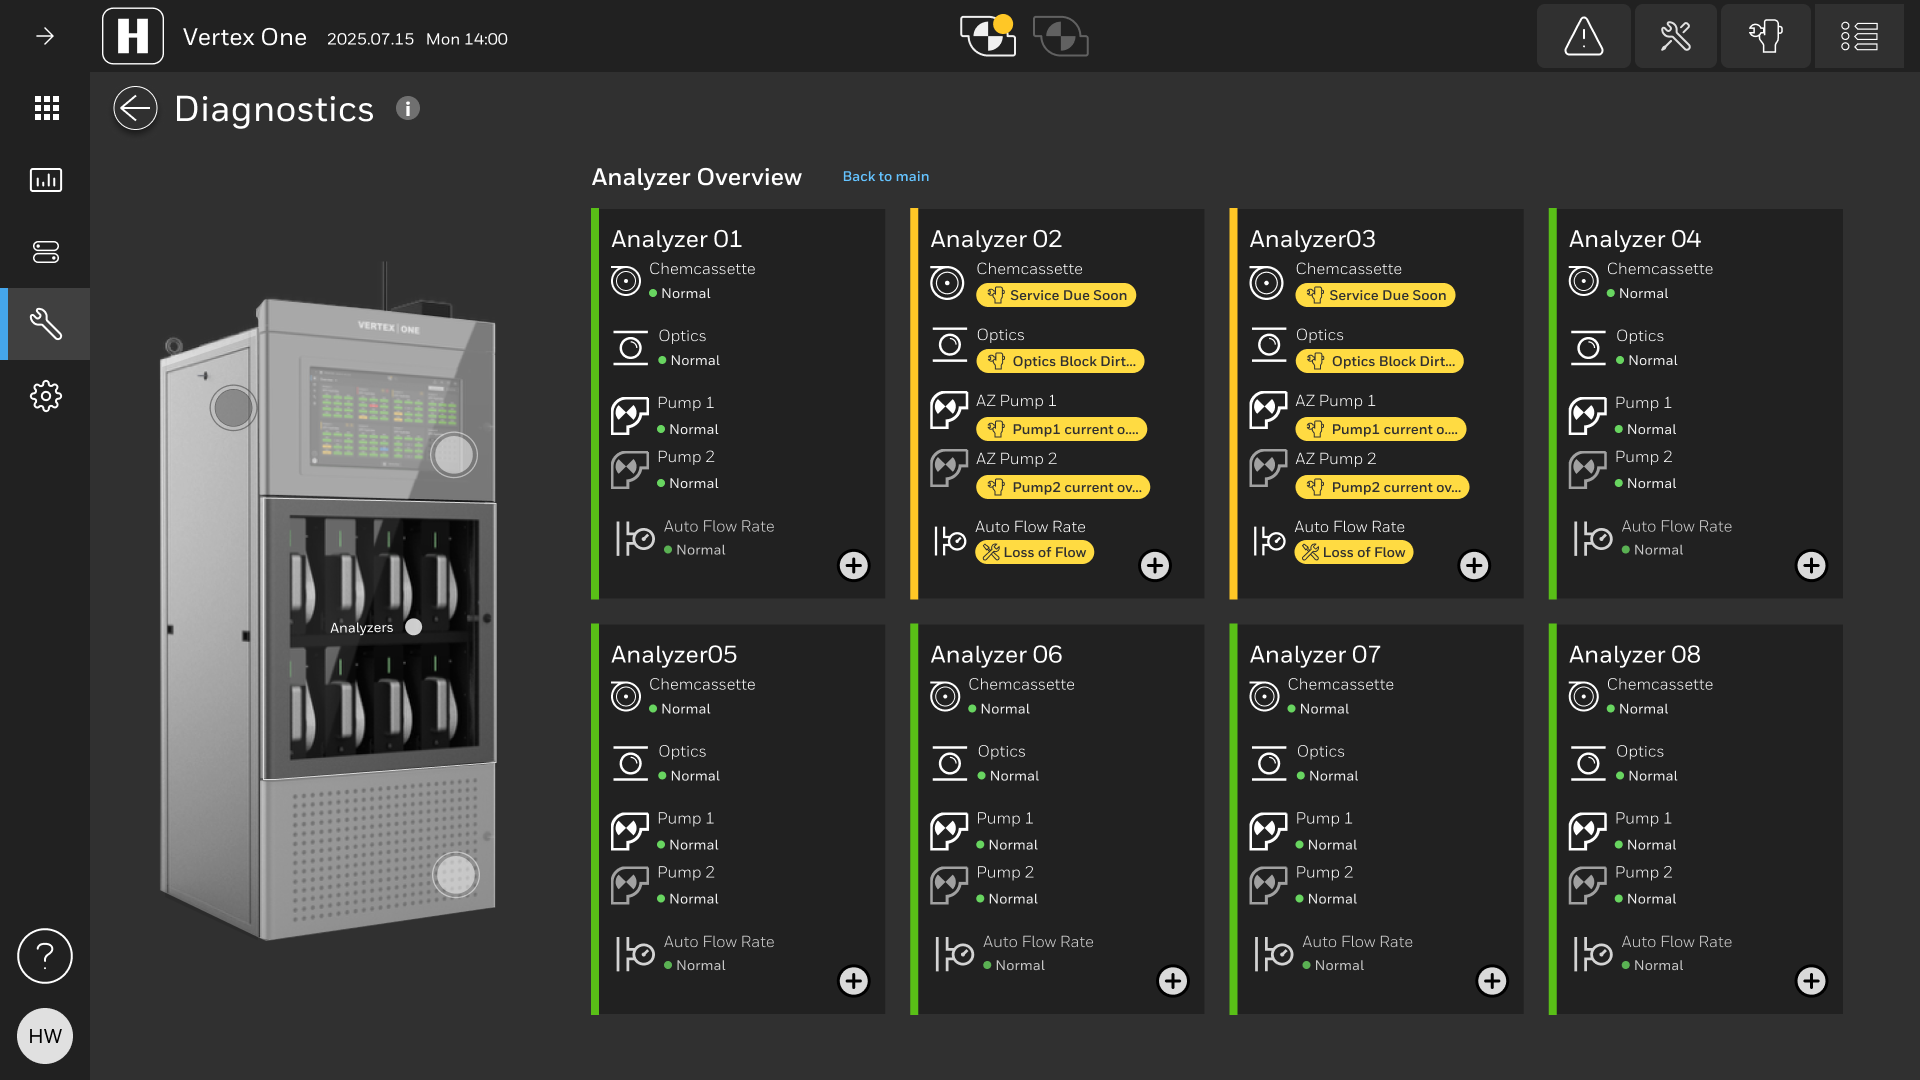
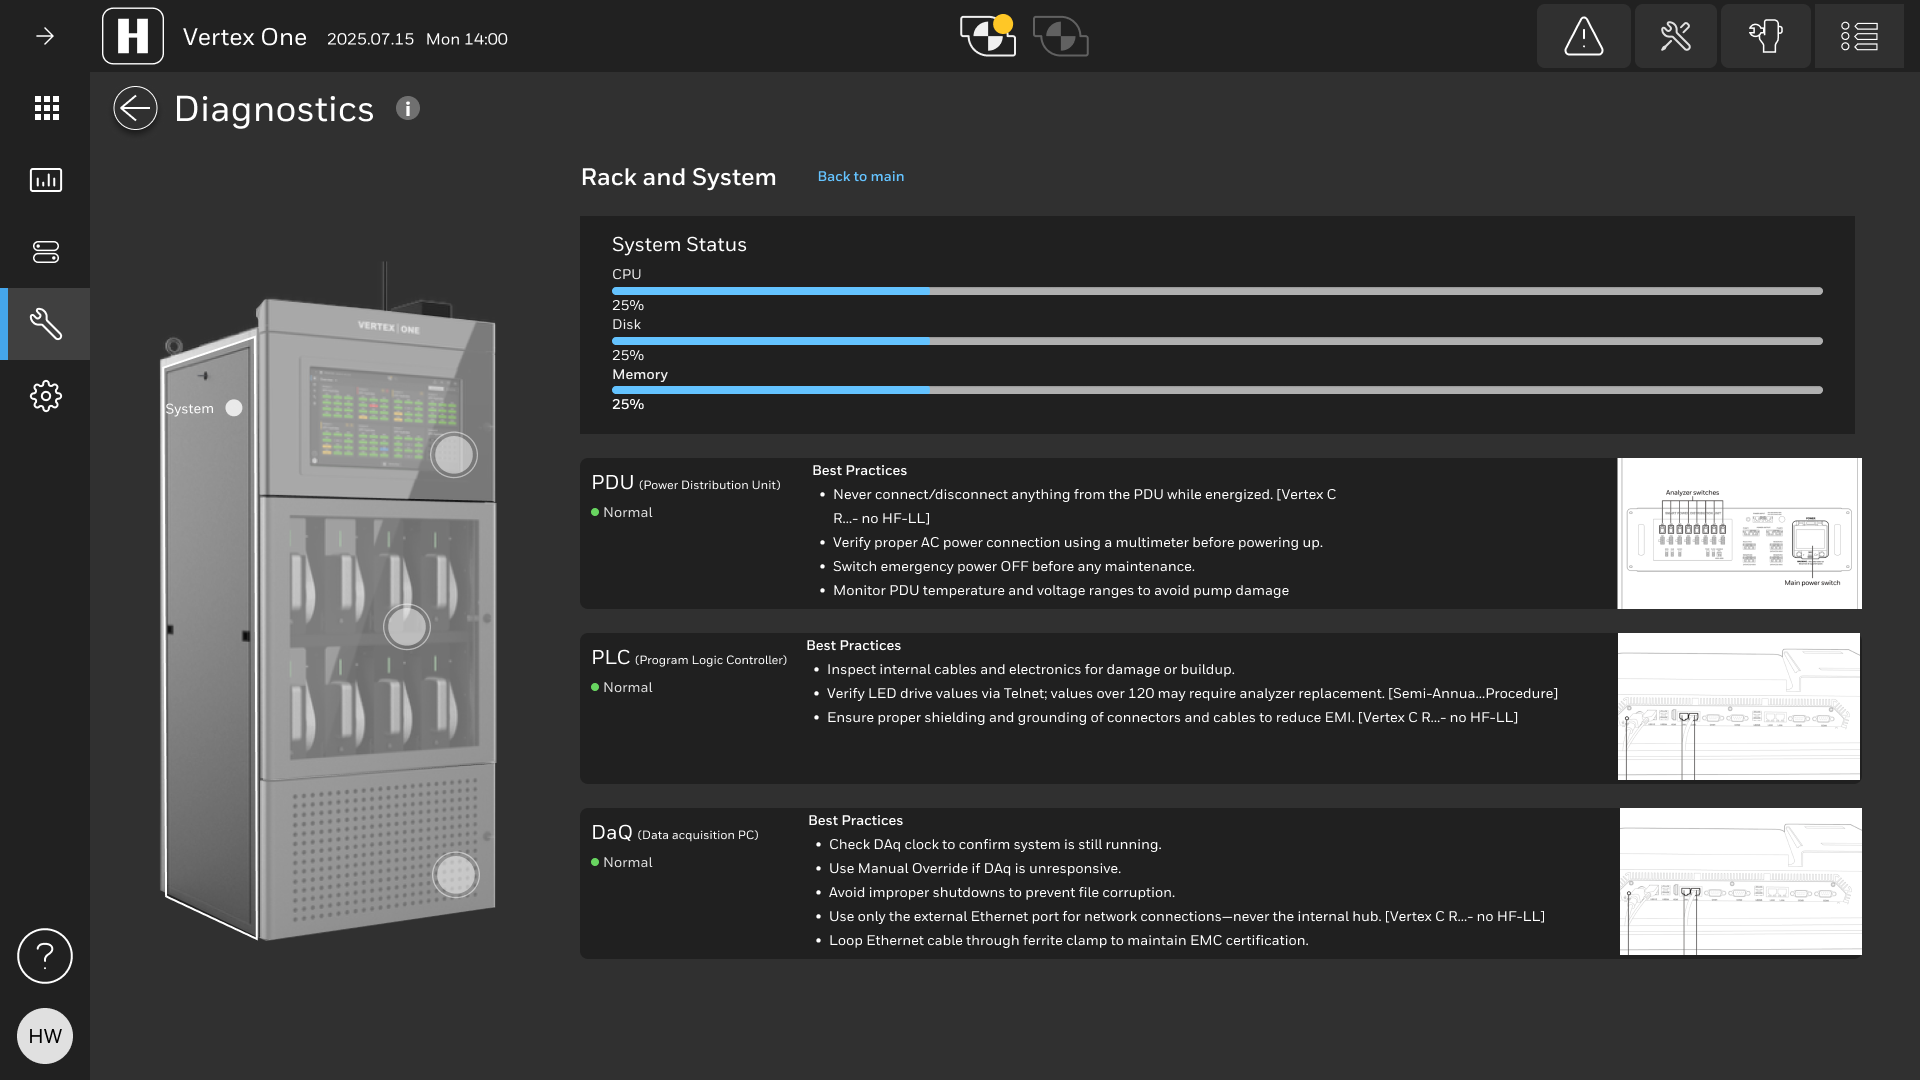
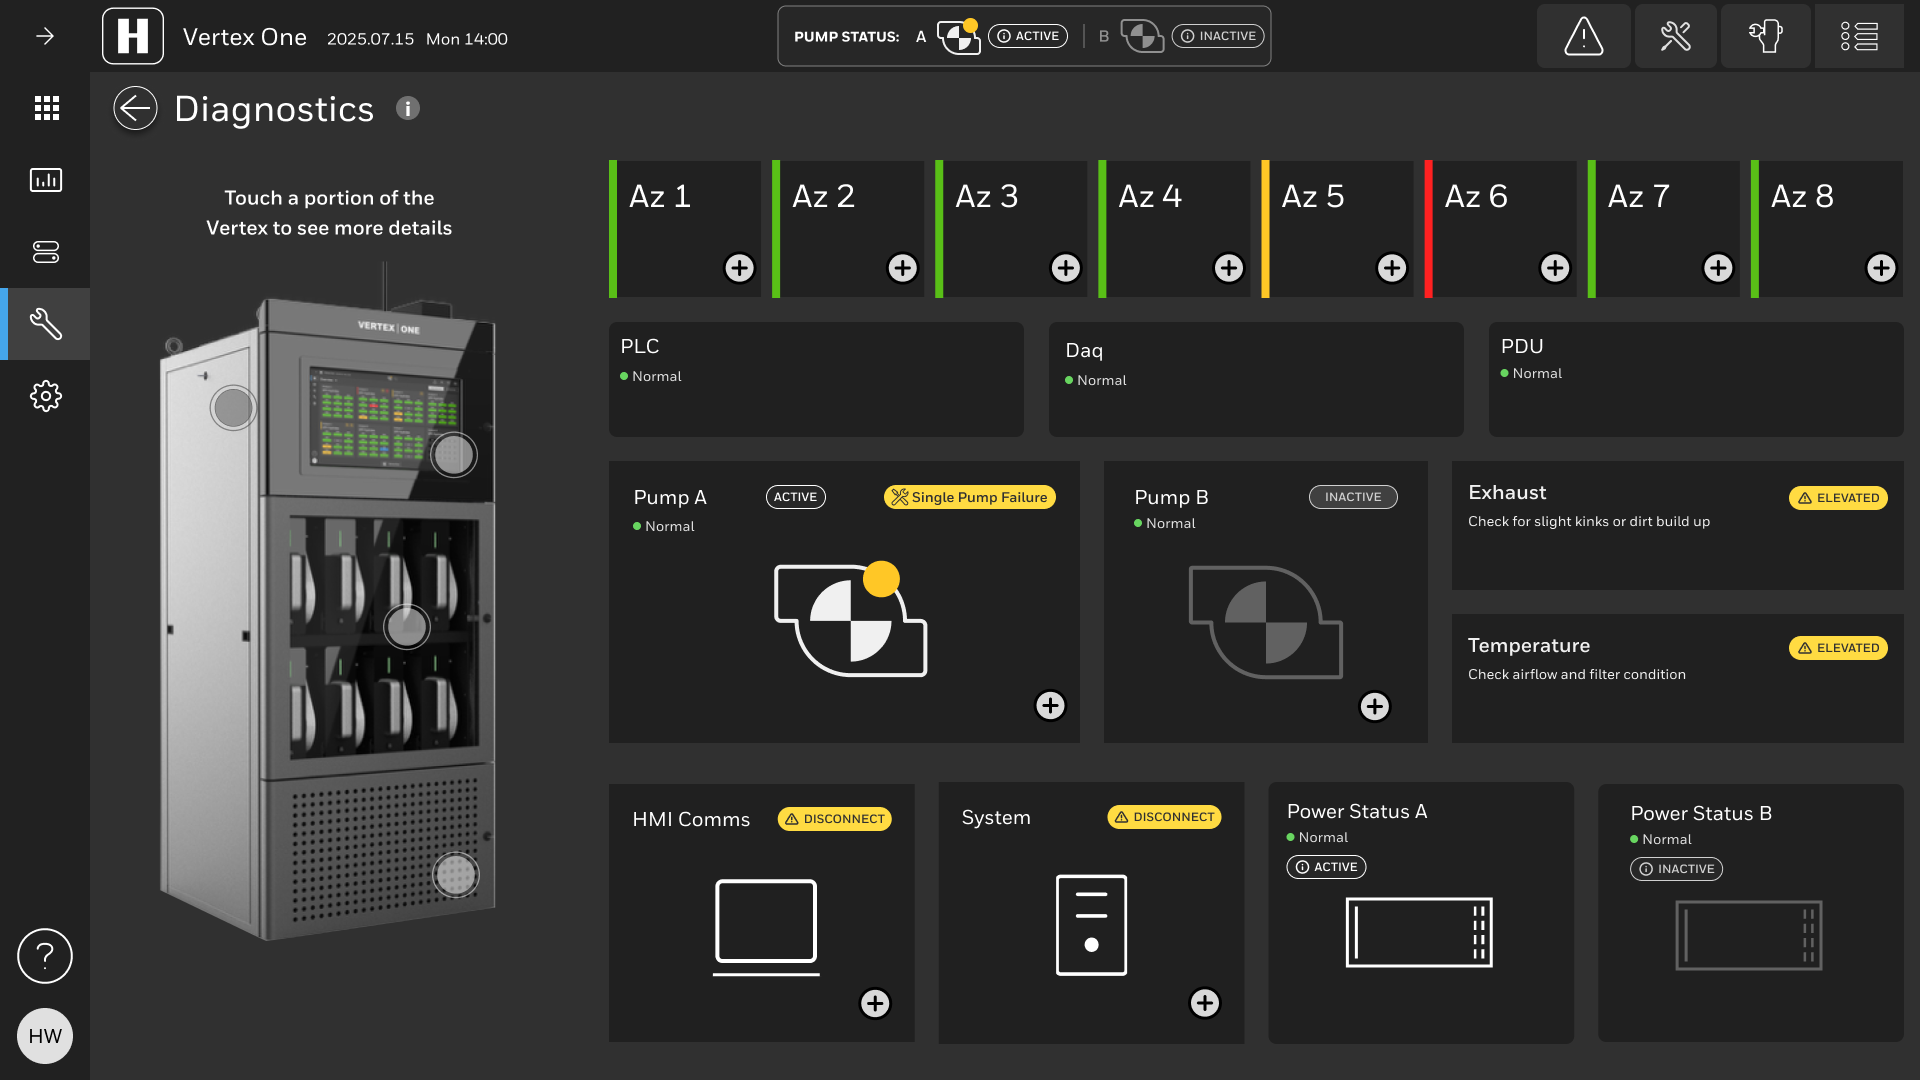
Overview screens and event panels
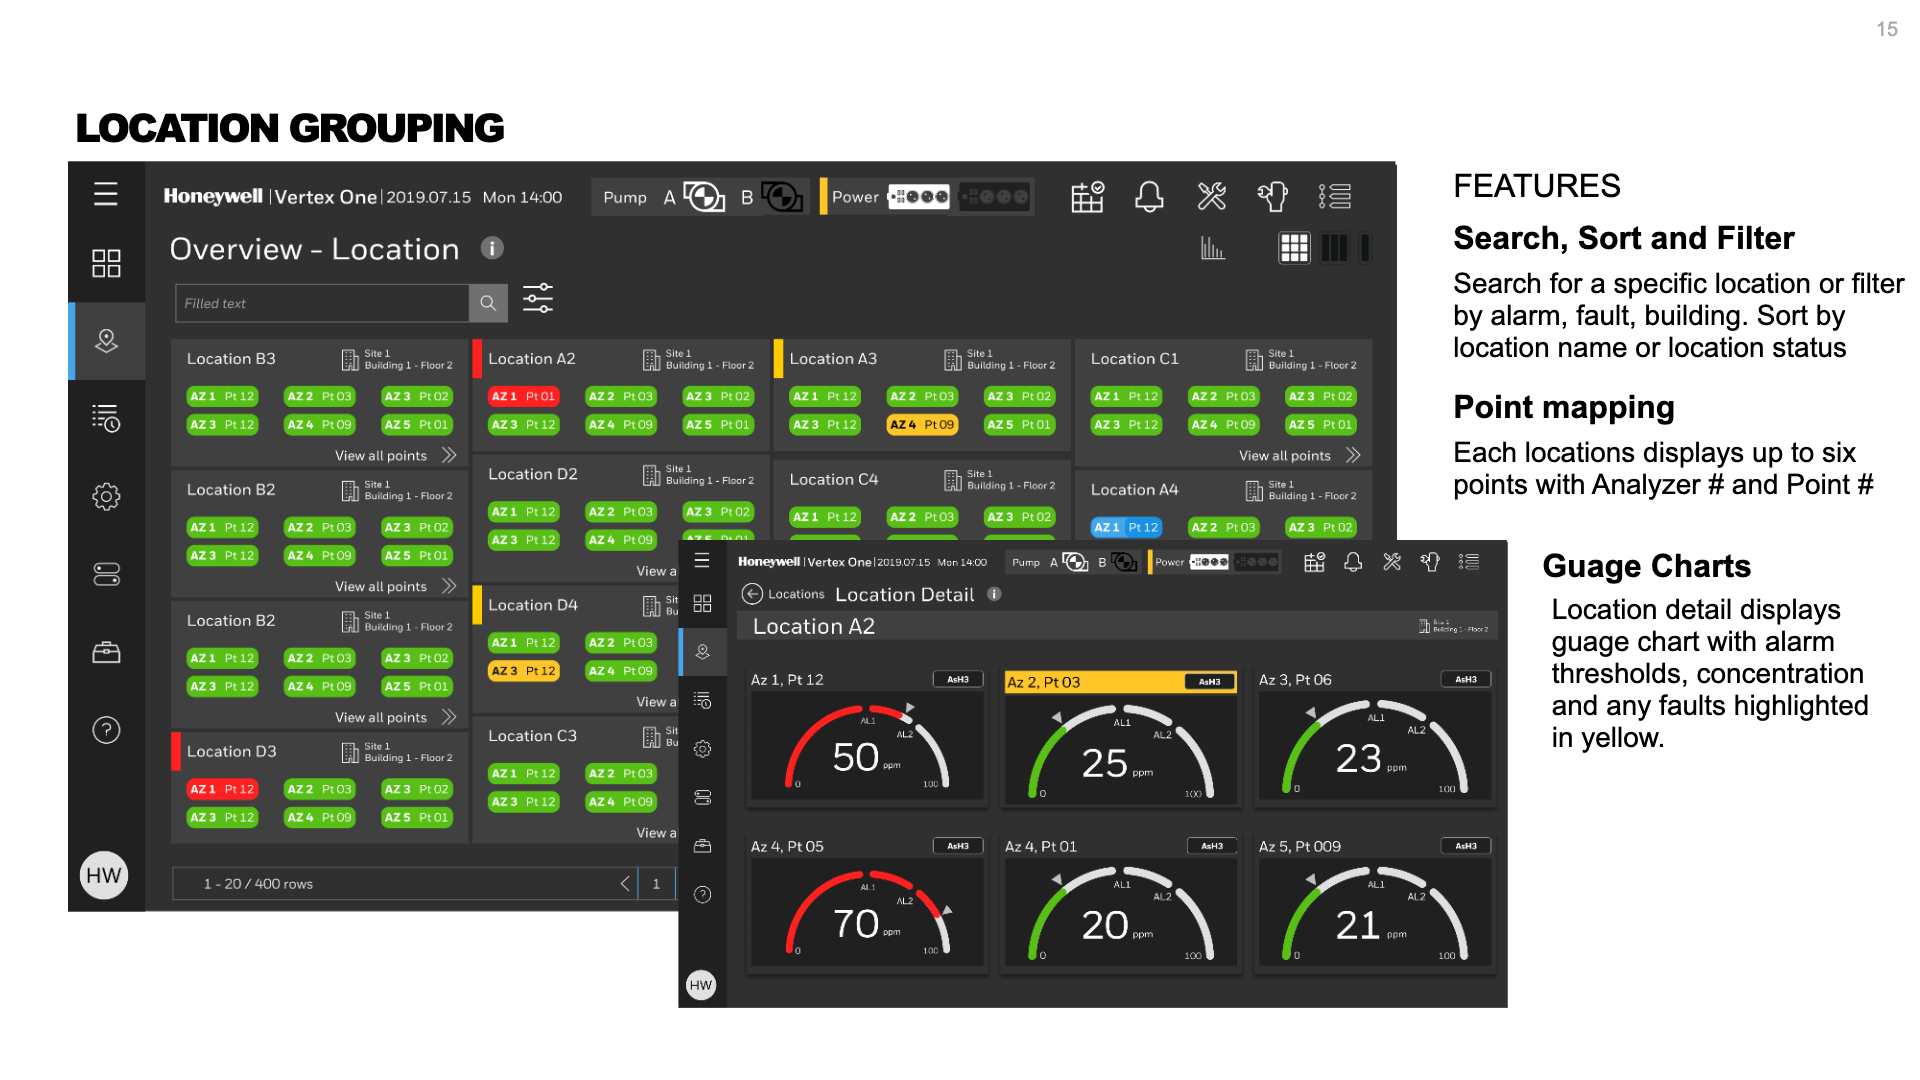
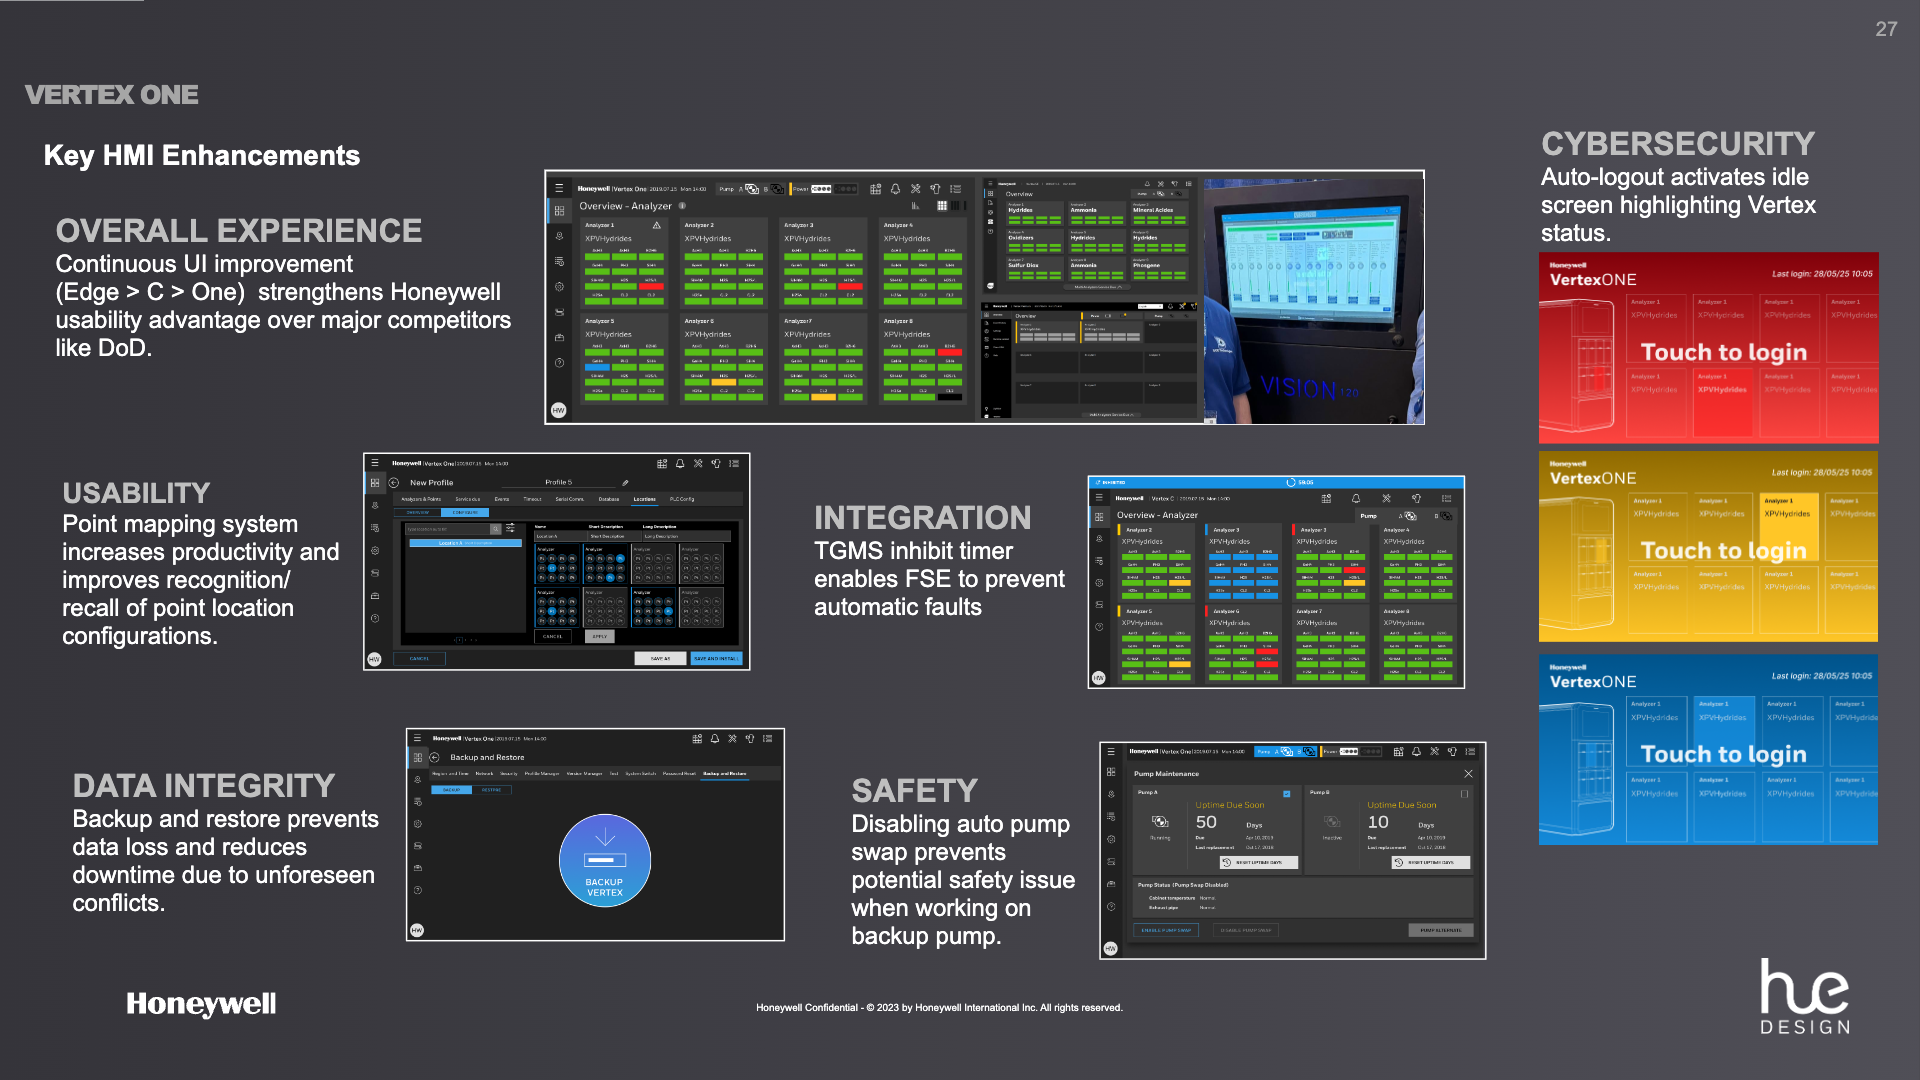
The new scan line mirrors the exterior indication of alarms and alerts. The icons within alarm and faults on each point is a special consideration for low vision and color blind users as red and green is a common challenge for color blind users. We made the pump status more easy to digest and more descriptive of faults since this is one of the differentiators the new Vertex. Location grouping was a submitted invention disclosure for this project as was another feature for disabling the automatic pump swap.
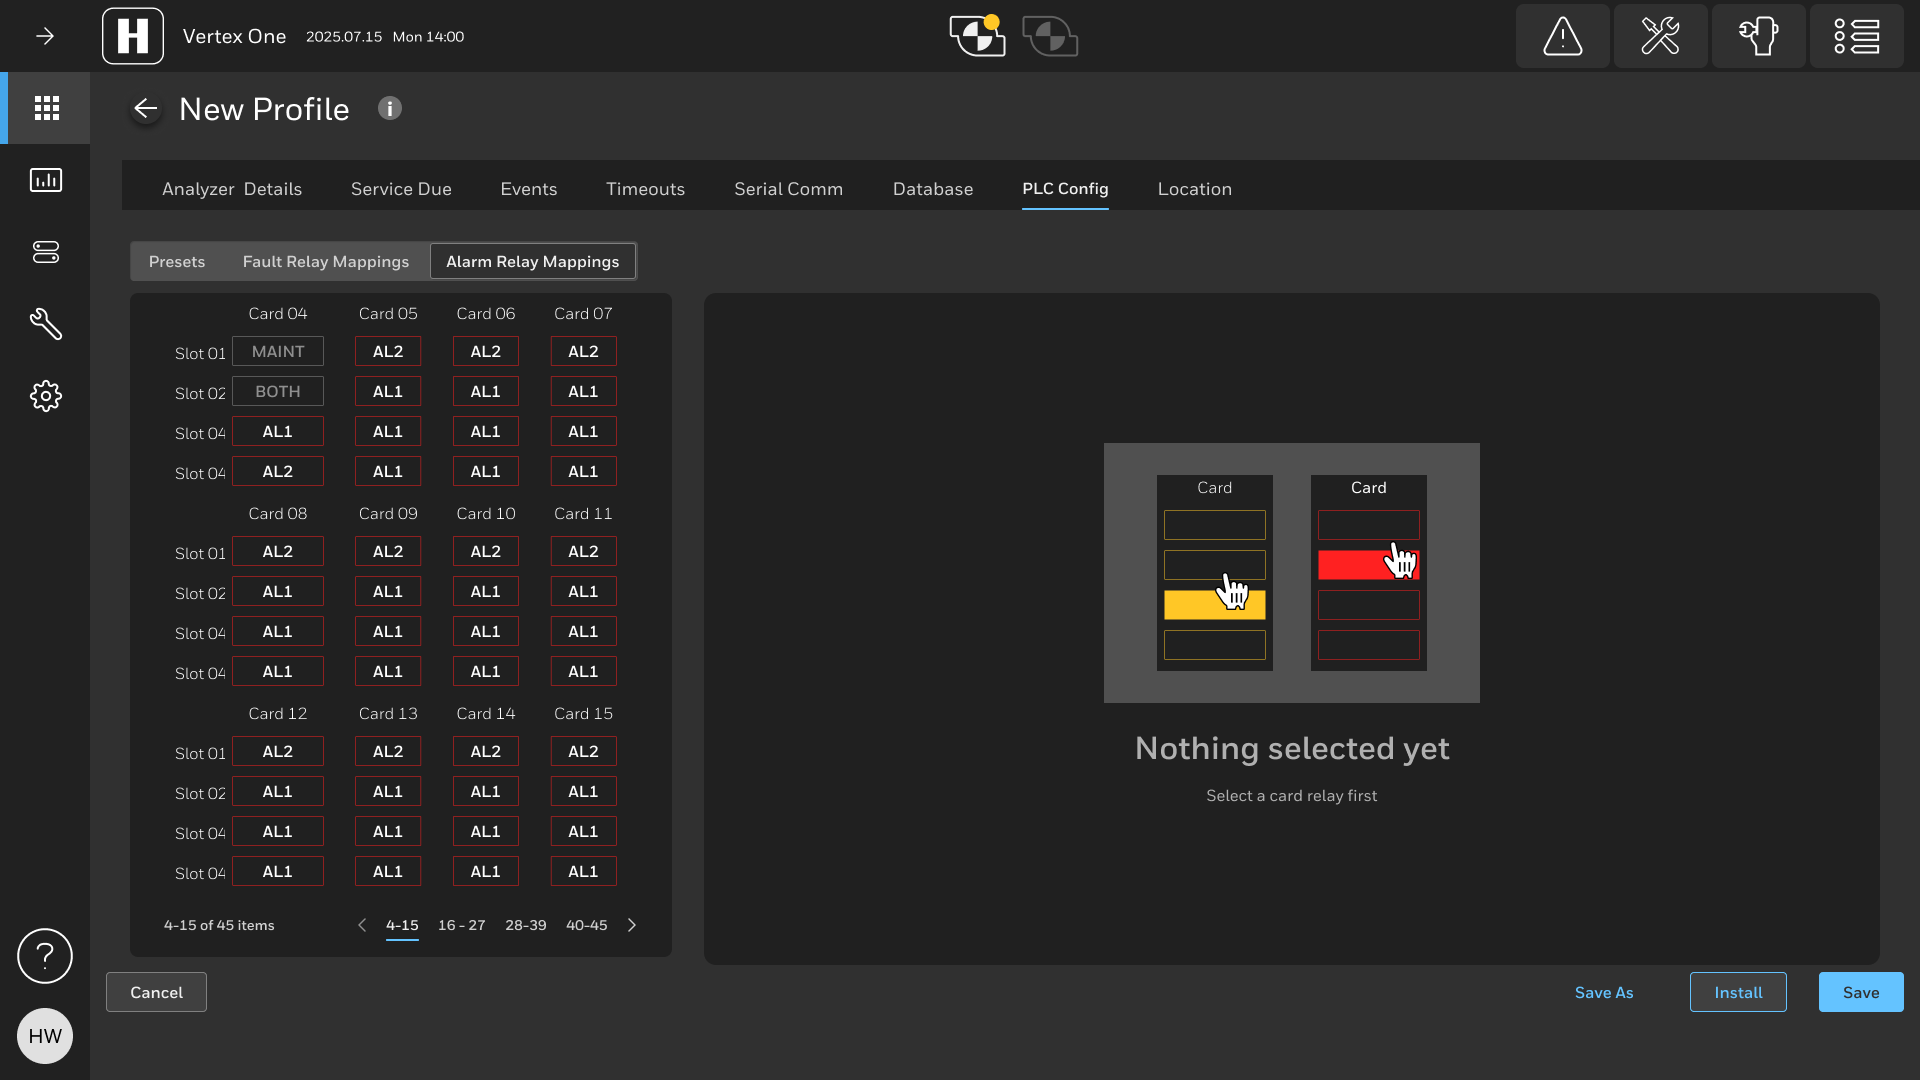
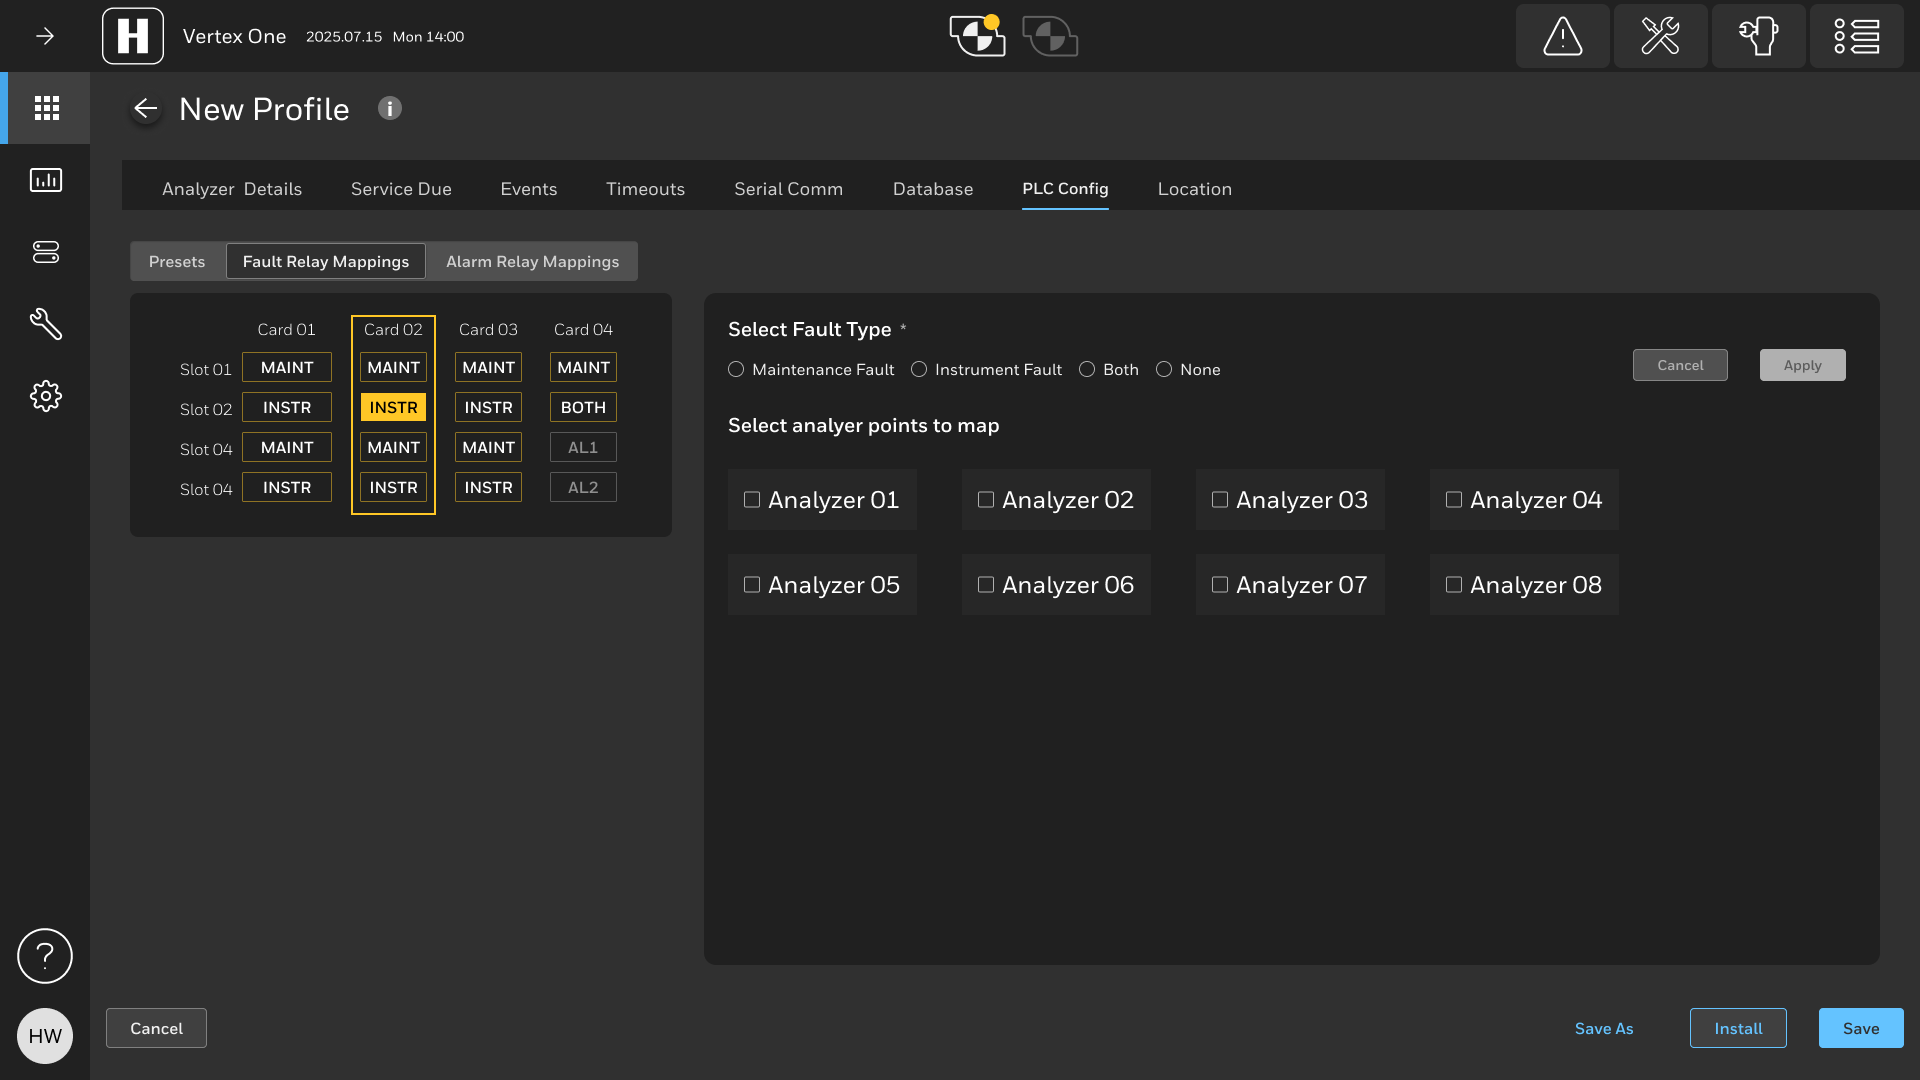
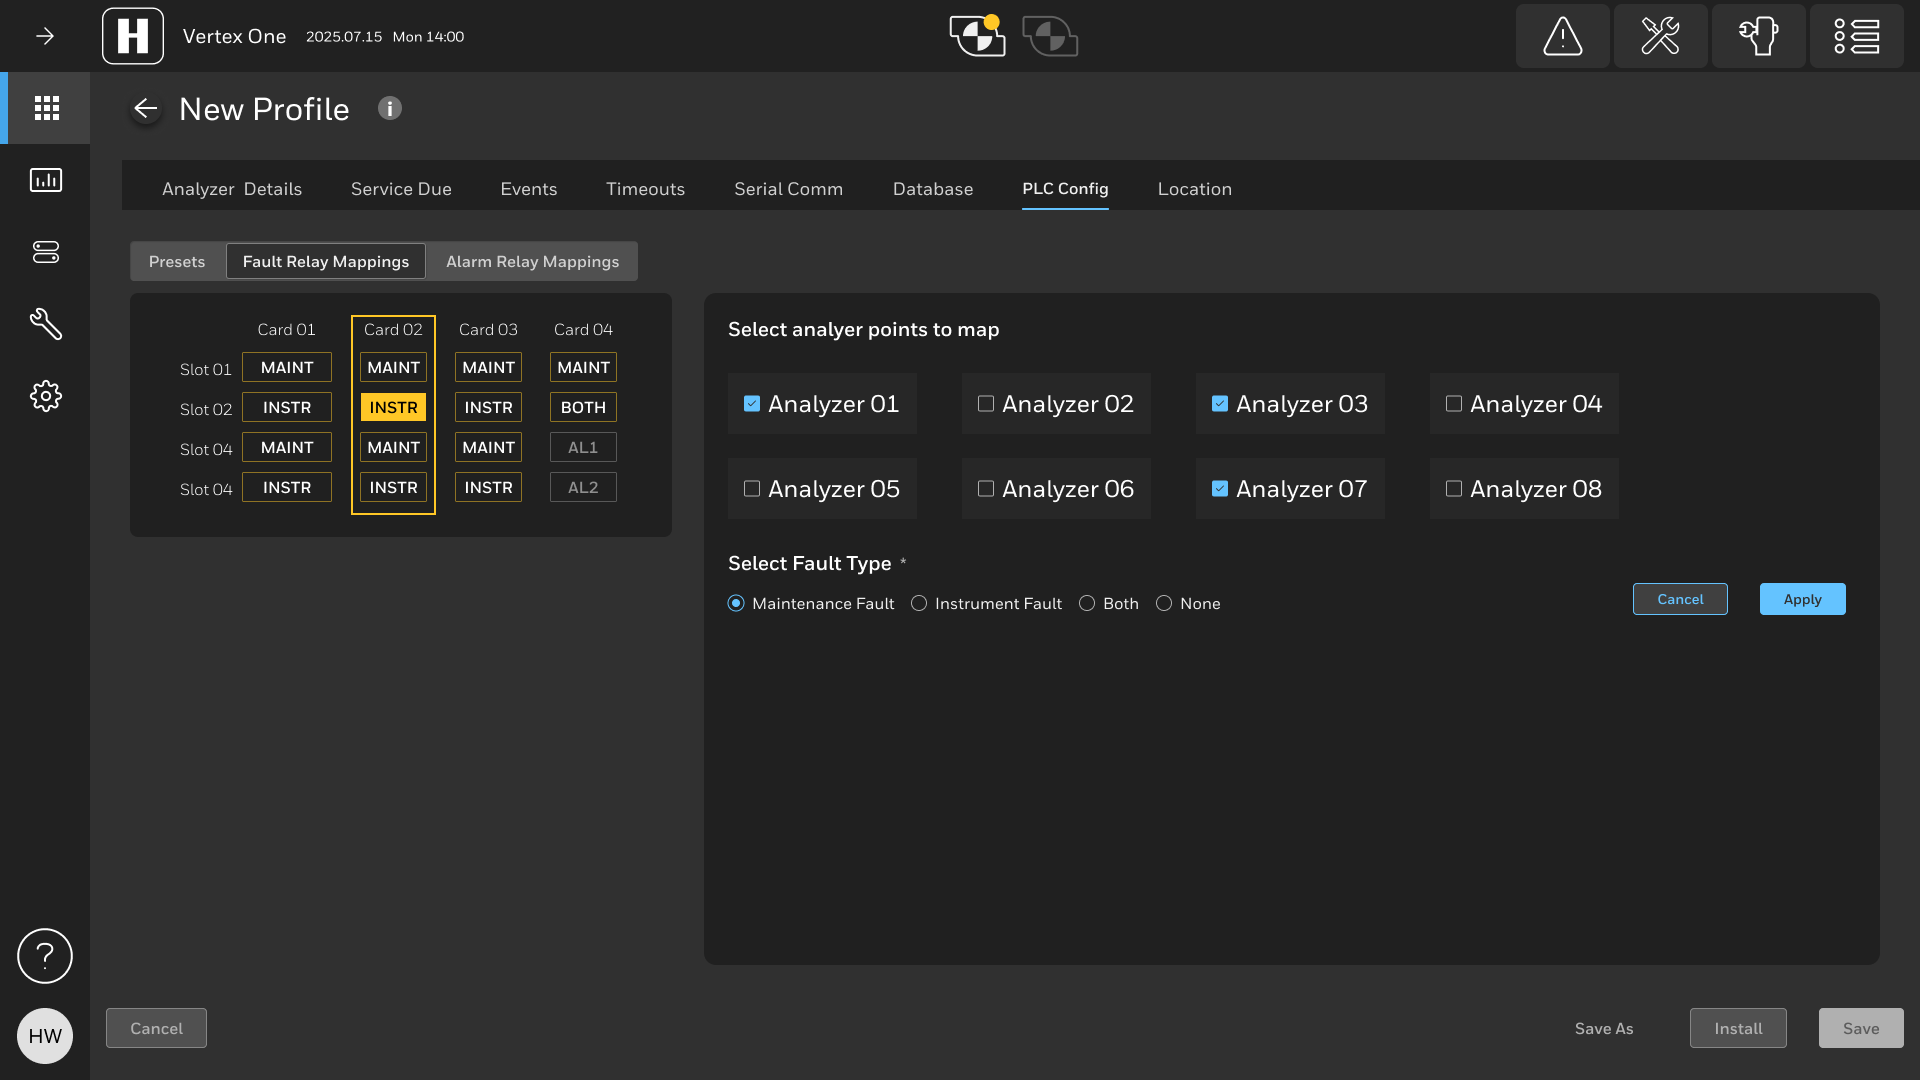
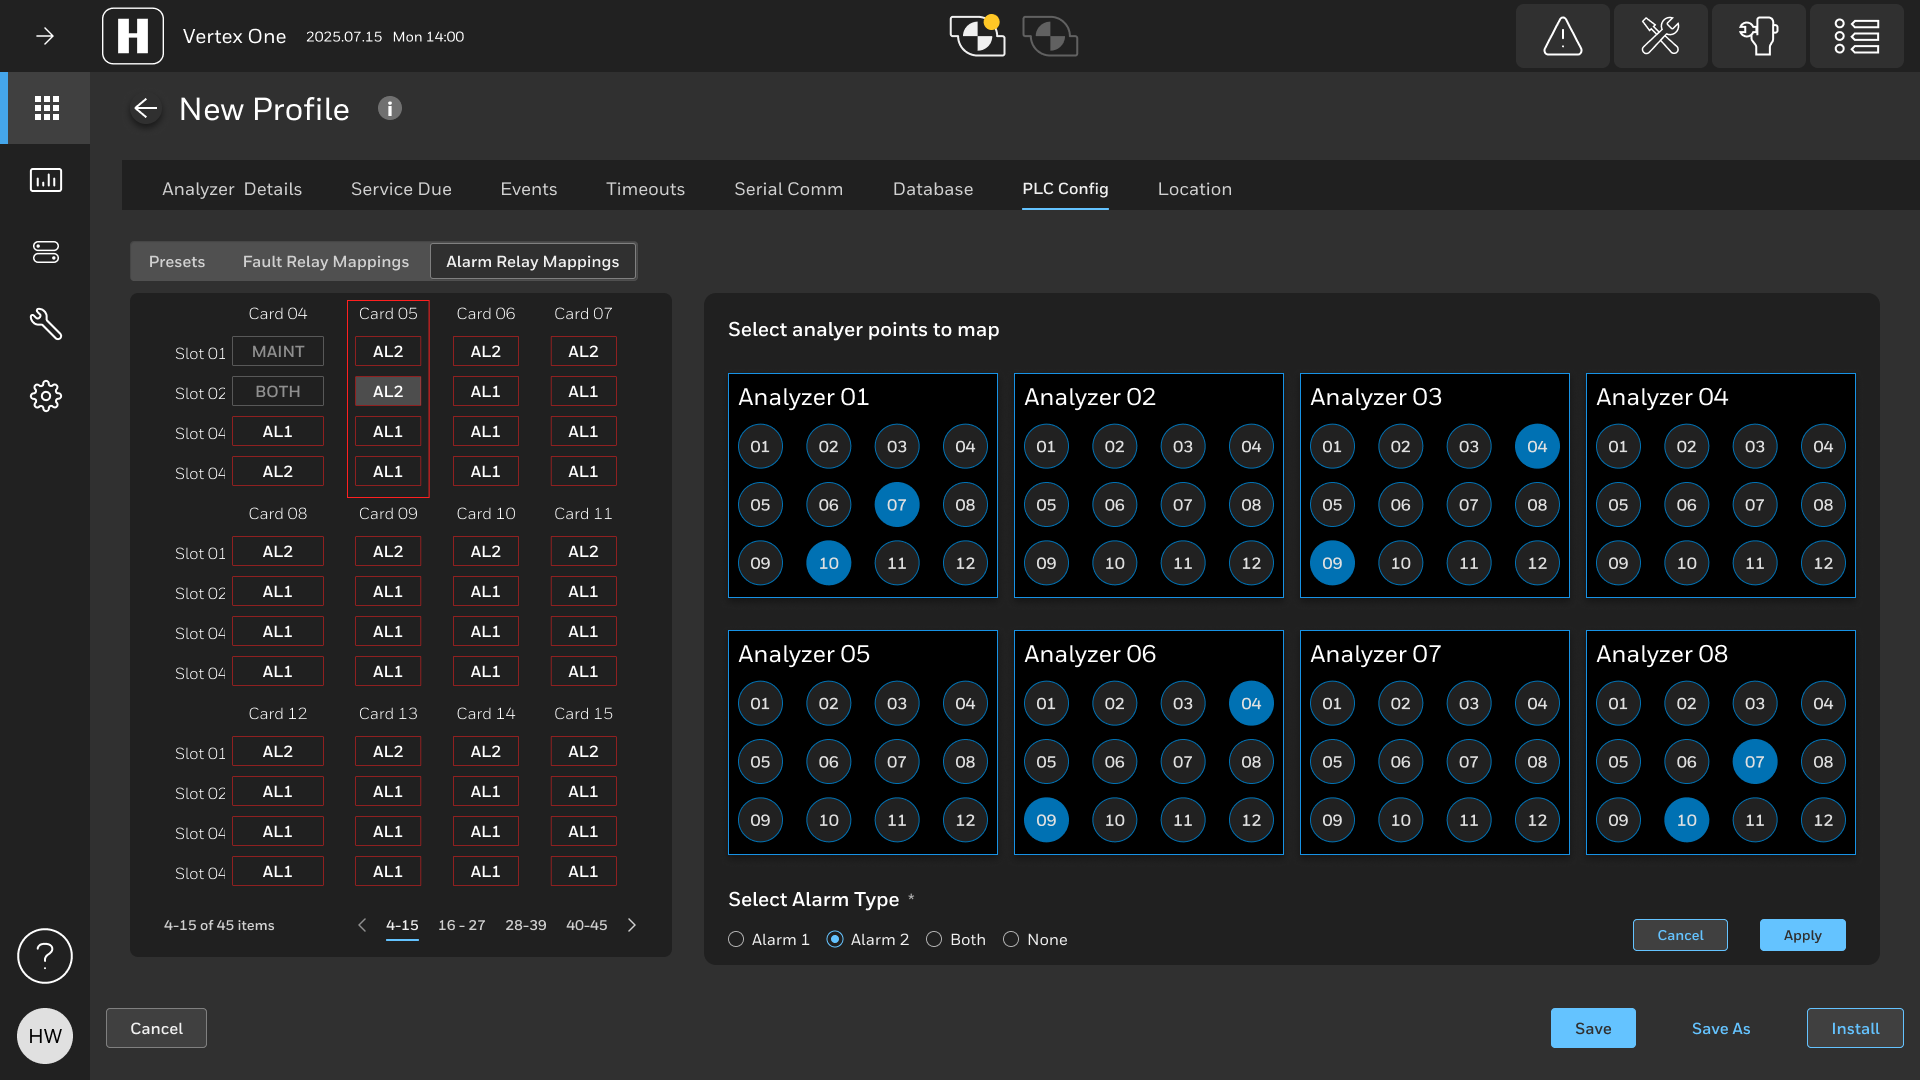
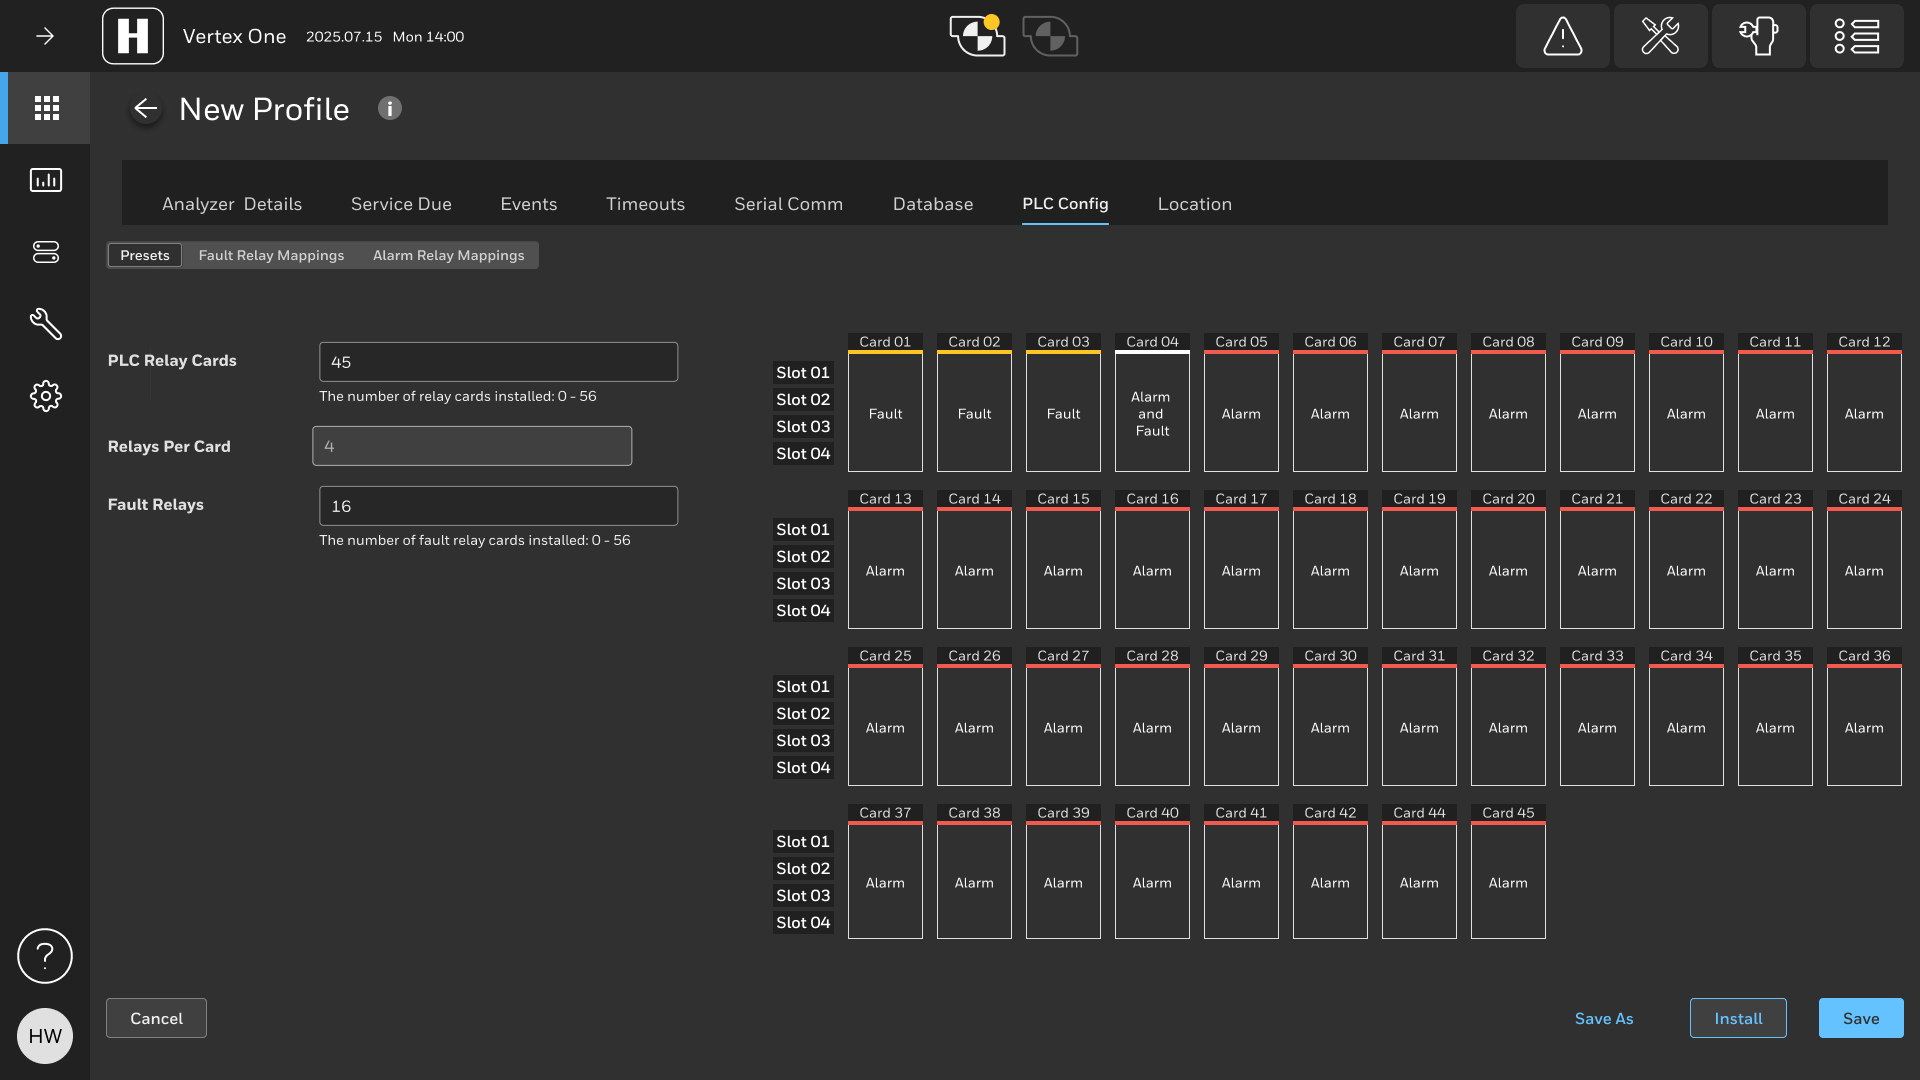
Listening to feedback
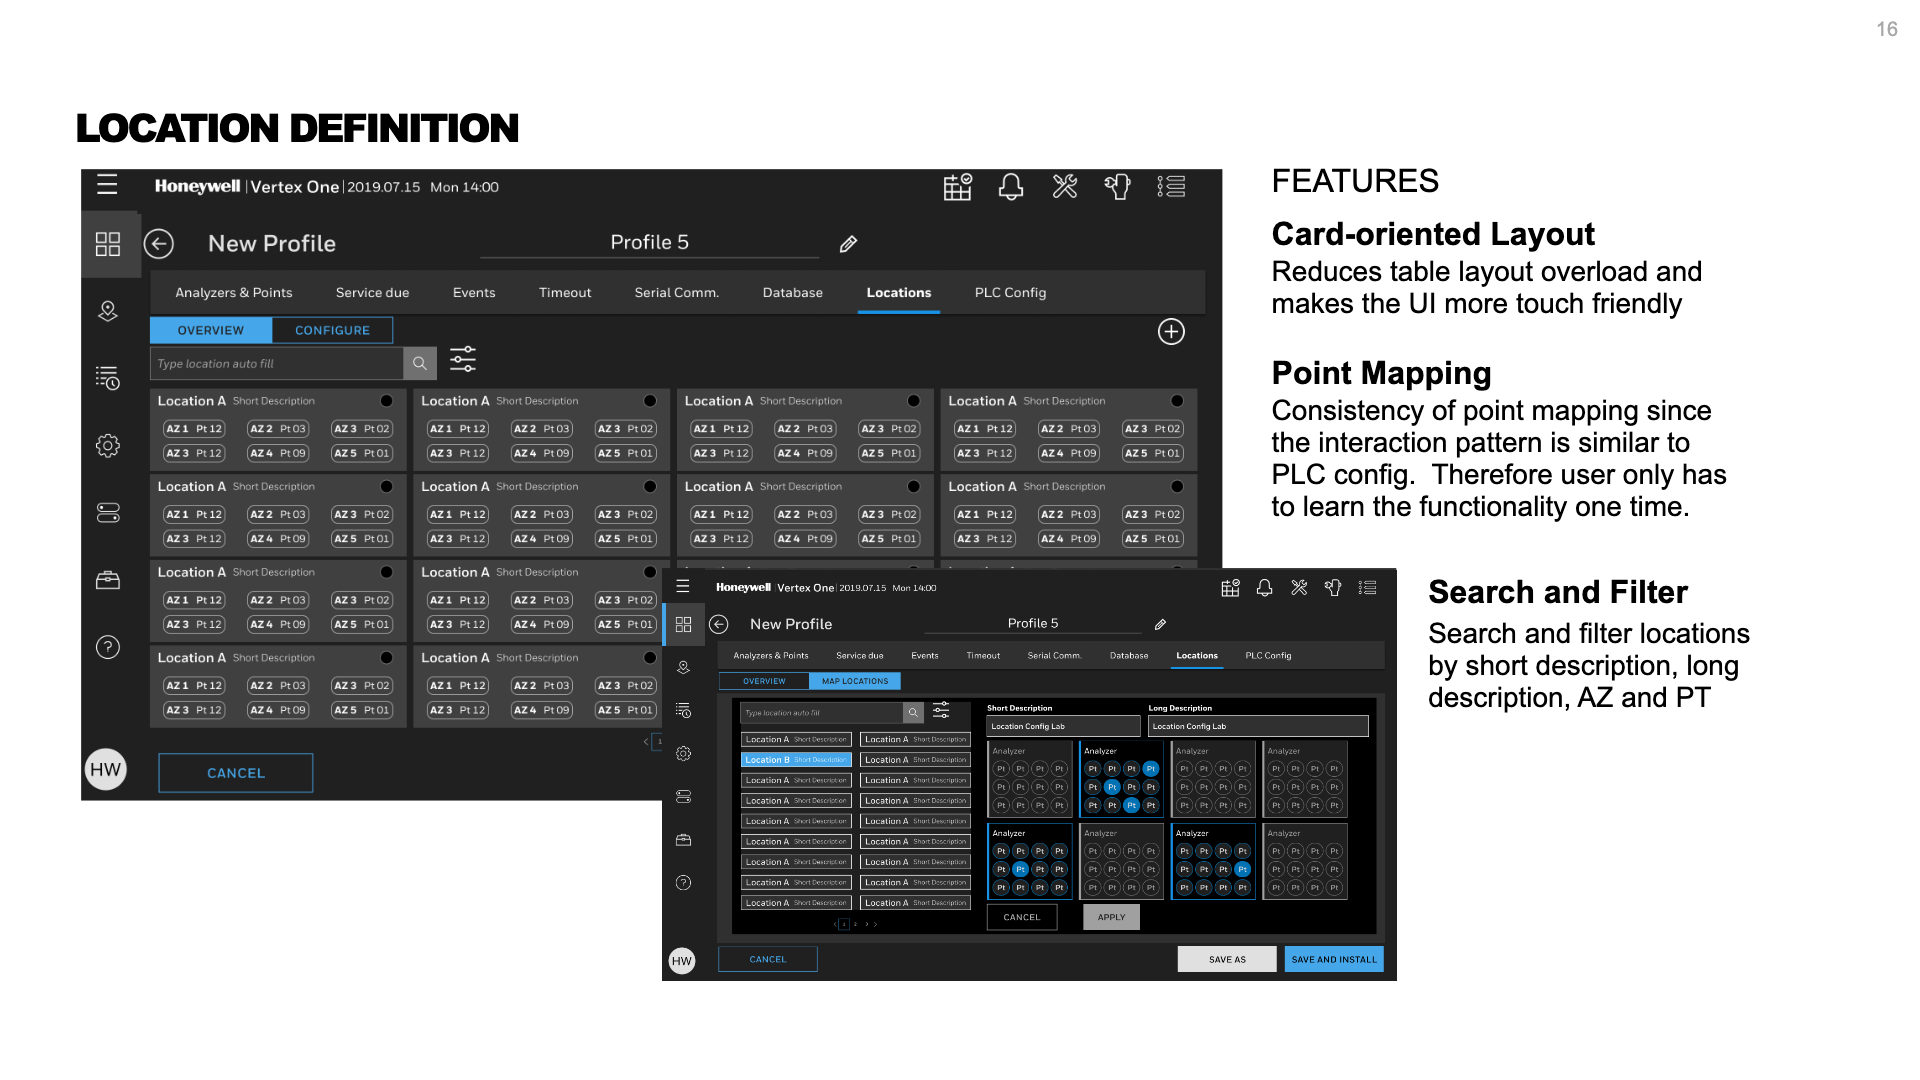
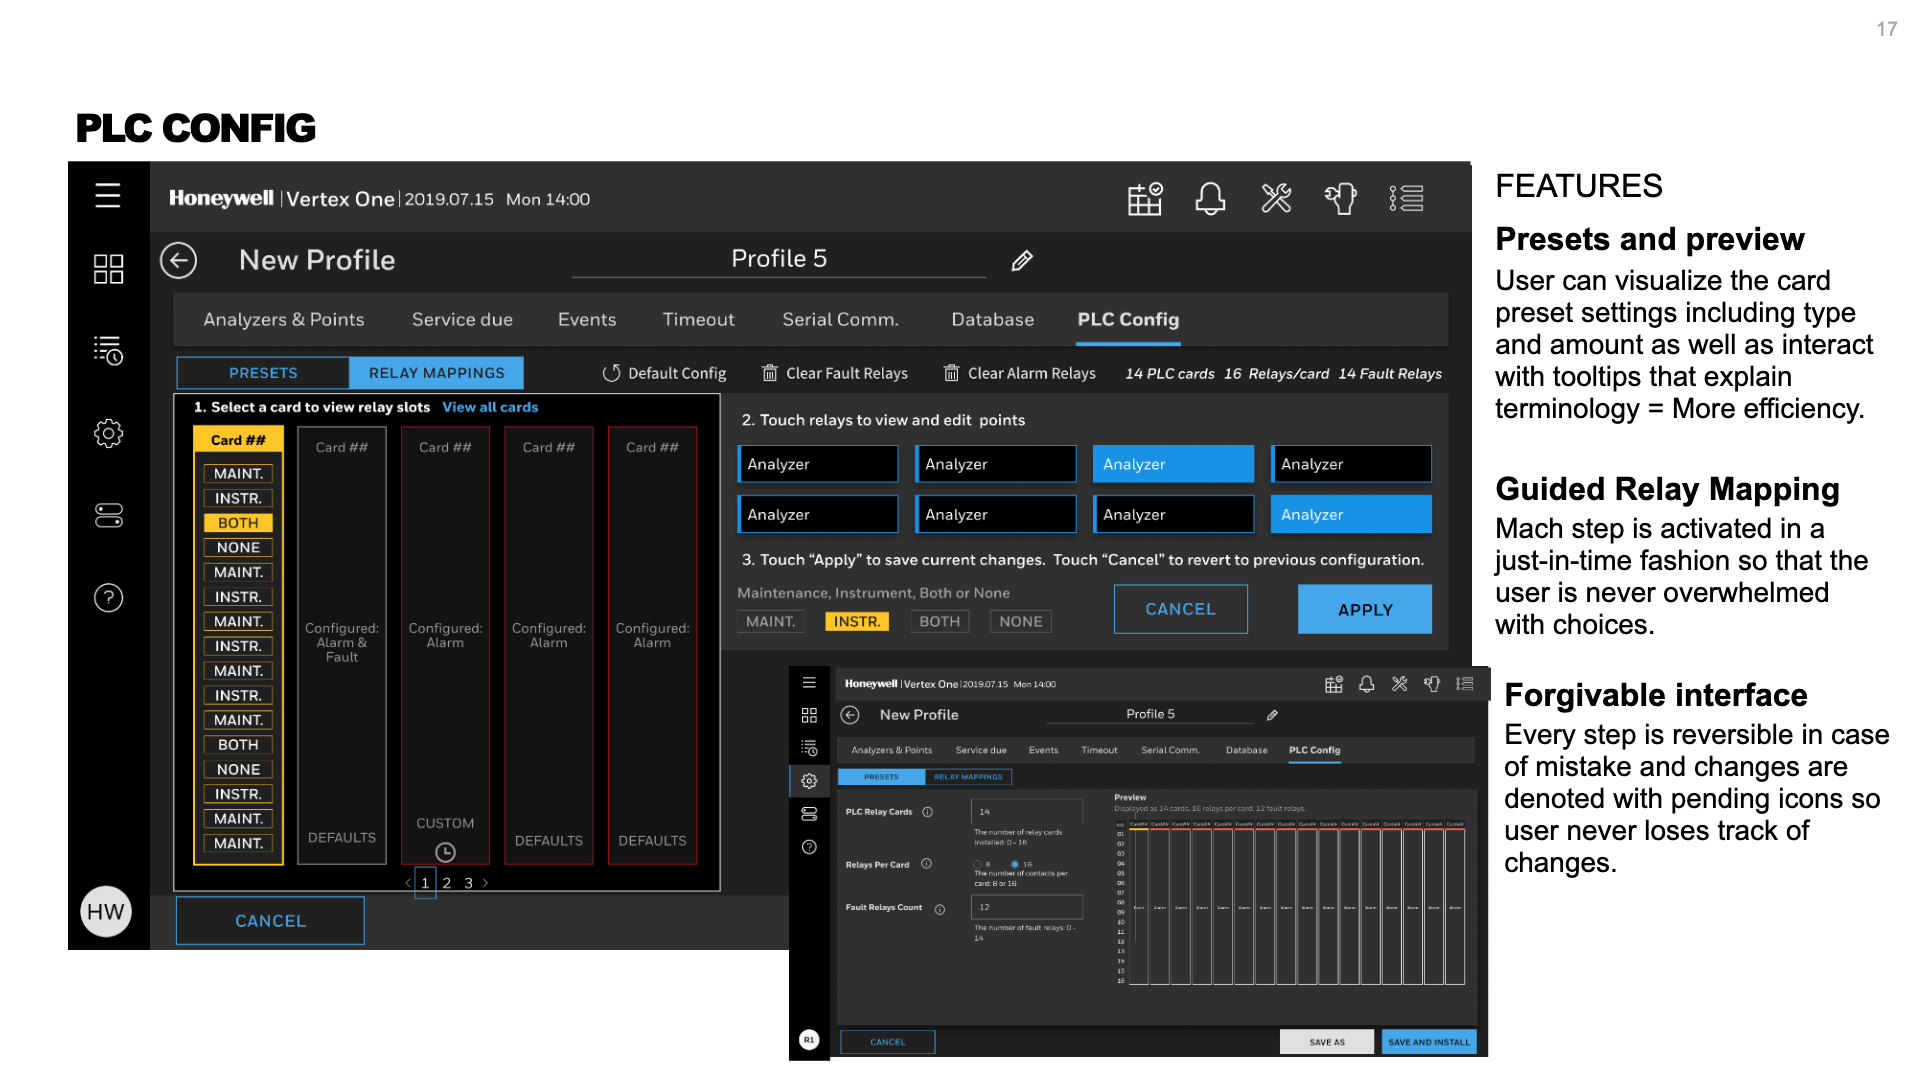
From the early tech support ticket analysis to field service technicians and actual customers we heard that configuring the PLC was too cumbersome. So this was fixed with the one-of-a-kind PLC touch configurator. It was almost a gamification of a mundane and complex task. The idea came from selecting seats in a stadium when purchasing a ticket and mapping that to the number of people attending. What options do they want with for their seats and who should be notified.
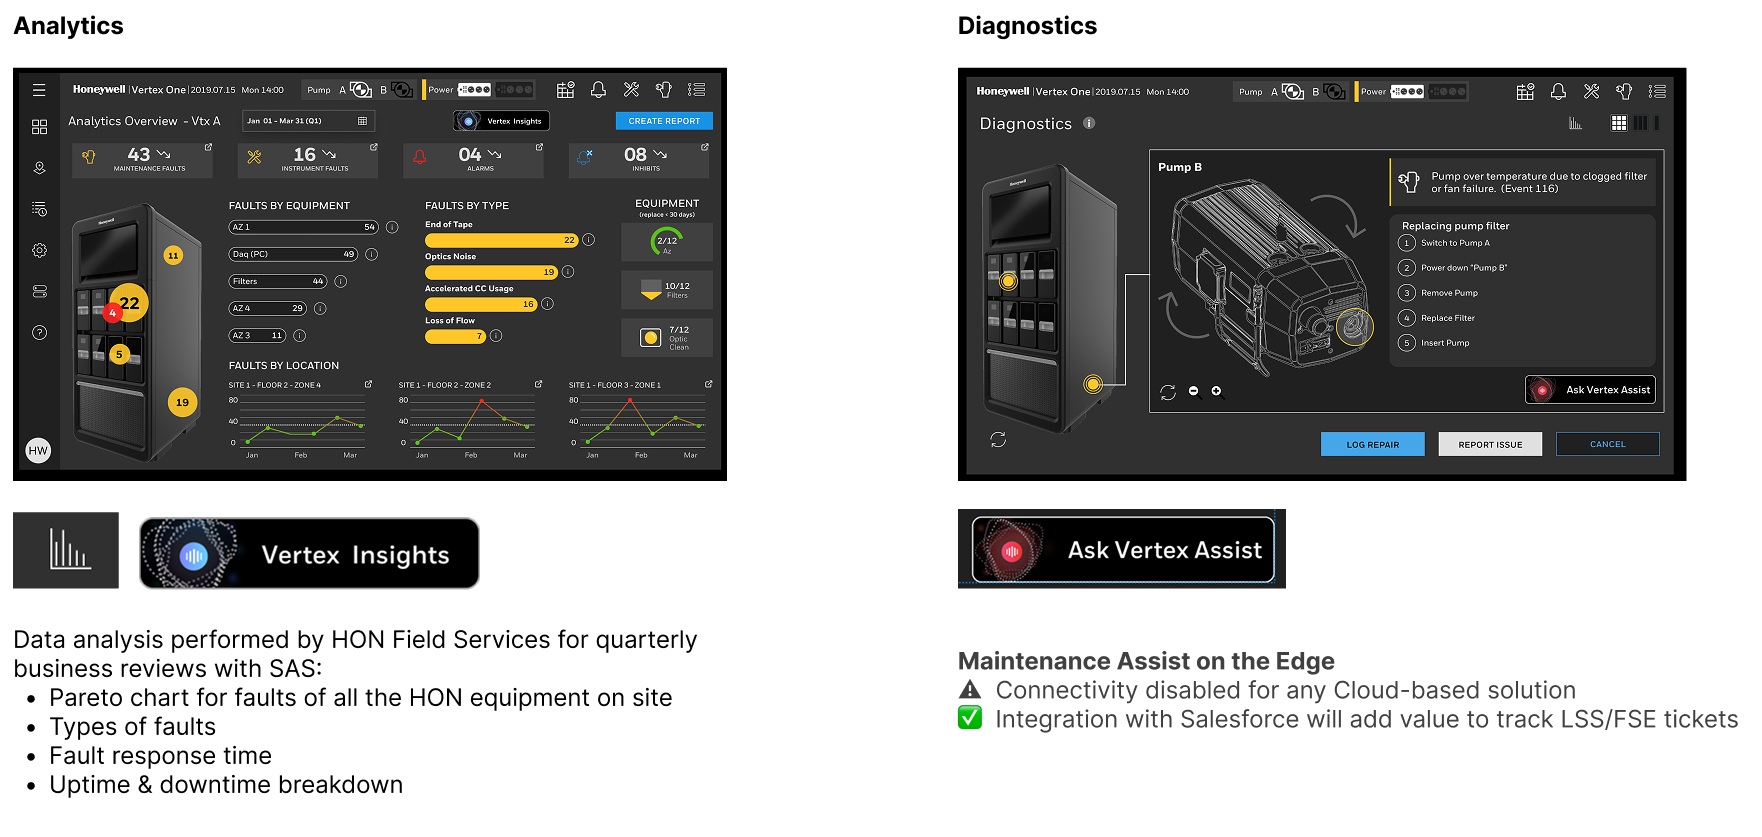
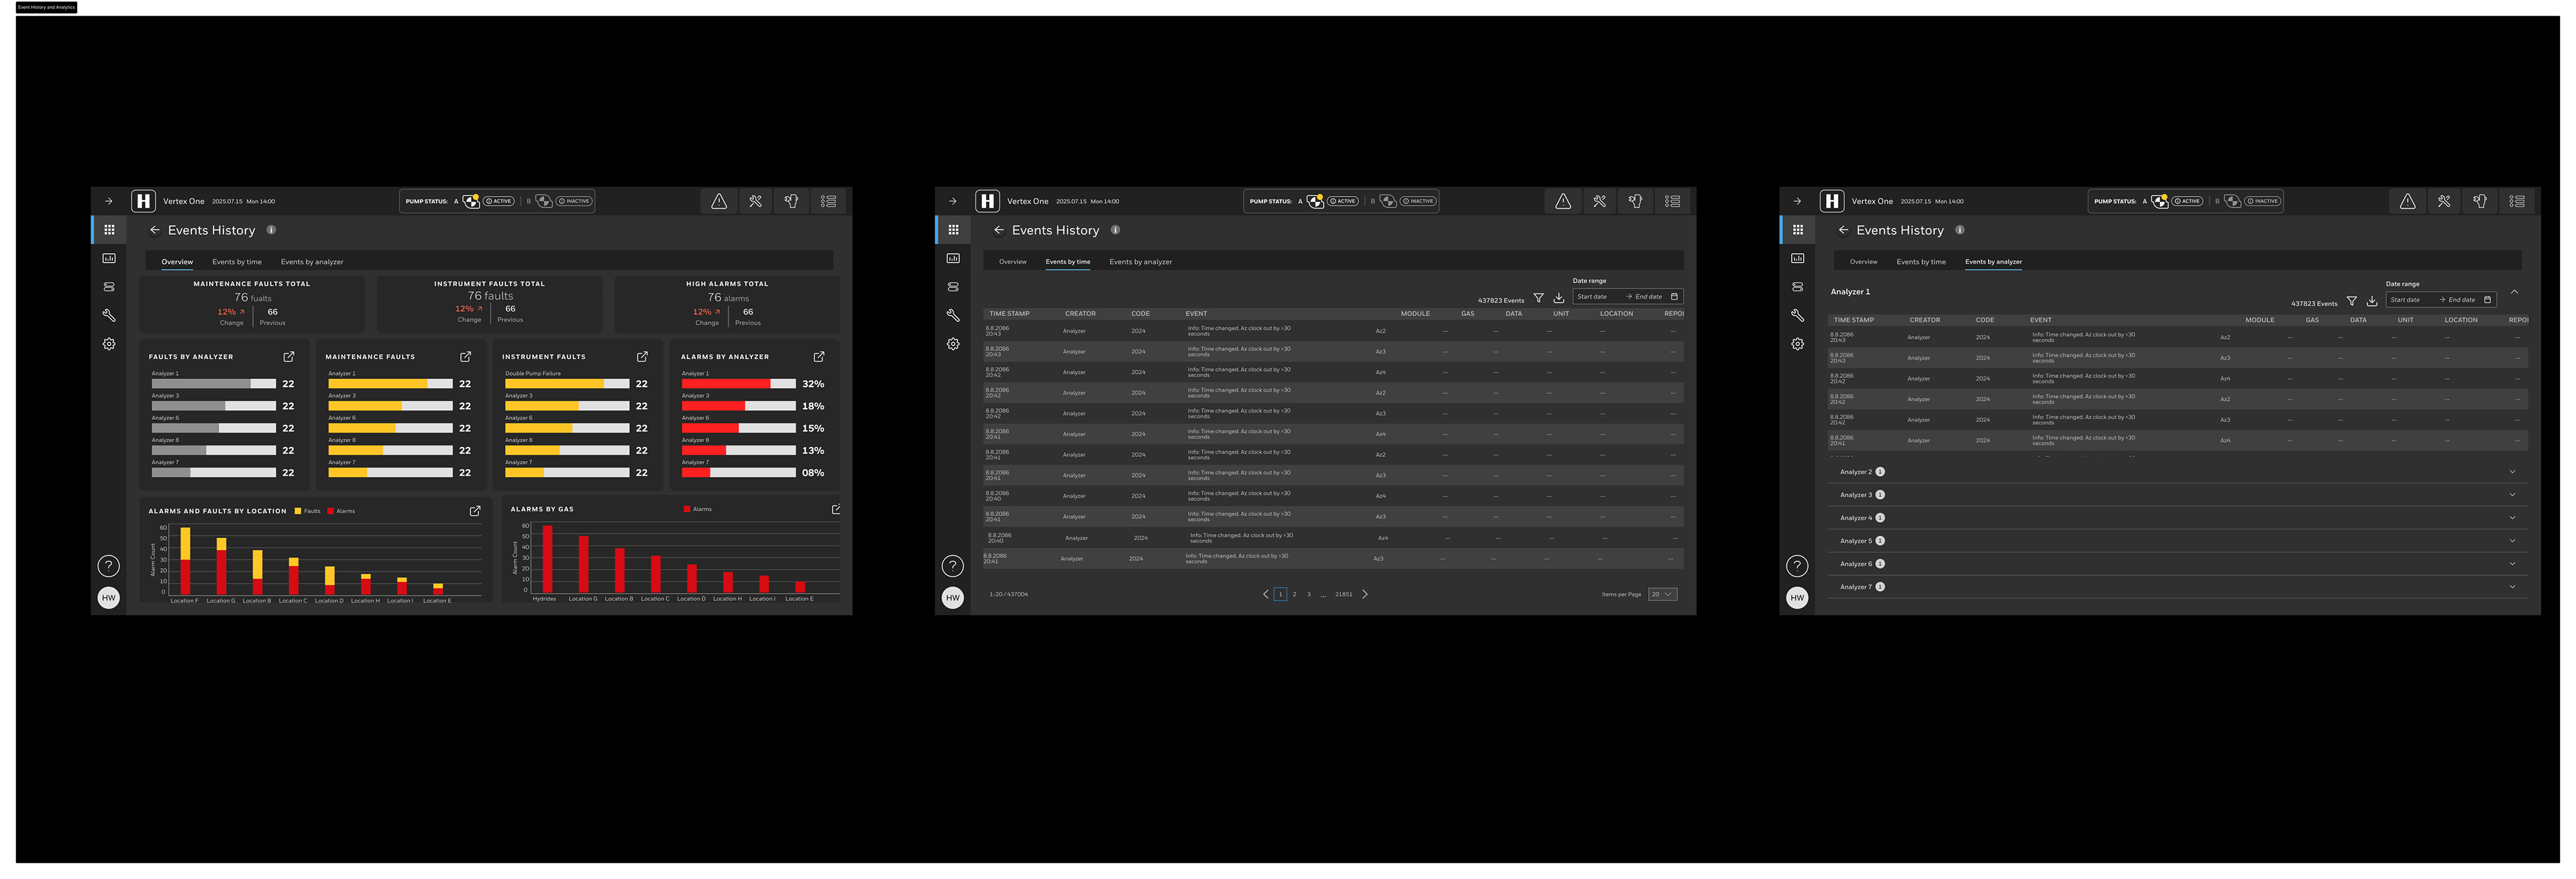
Analytics and Event History
We also heard that field service technicians wanted more insights into faults and alarms on the Vertex. So we provided easy to digest visulizations that also helped with the quarterly reporting process for customers. The resulting savings could amount to $1M+ annually and increase revenue for Honeywell in the high tech space.
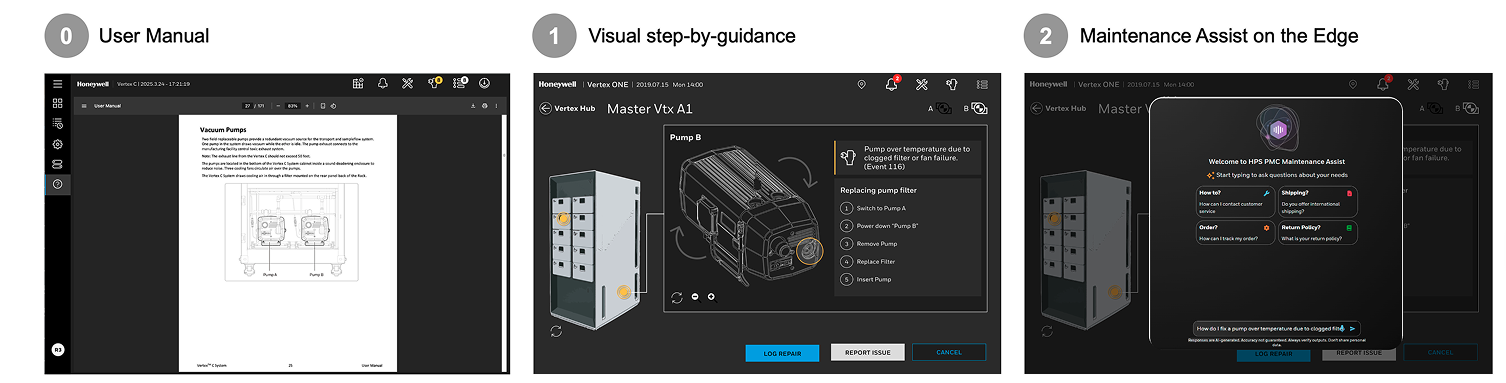
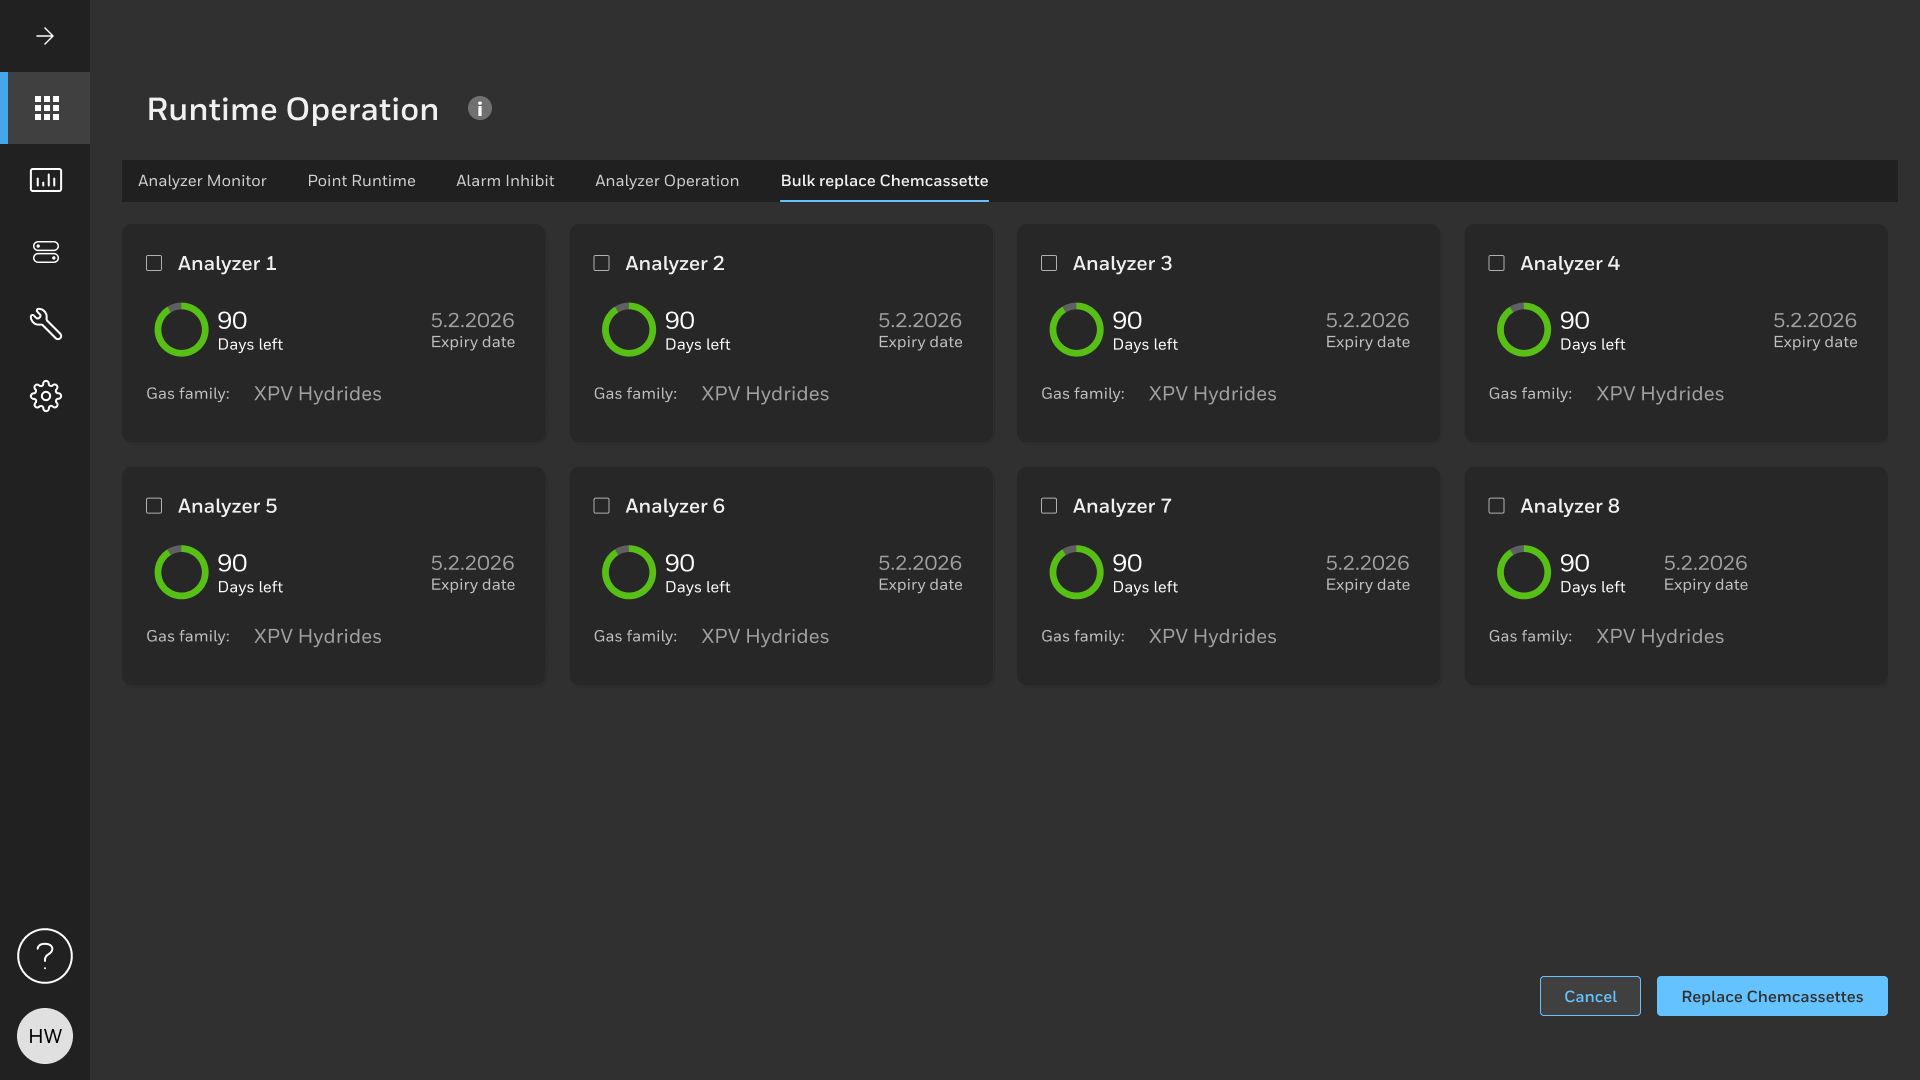
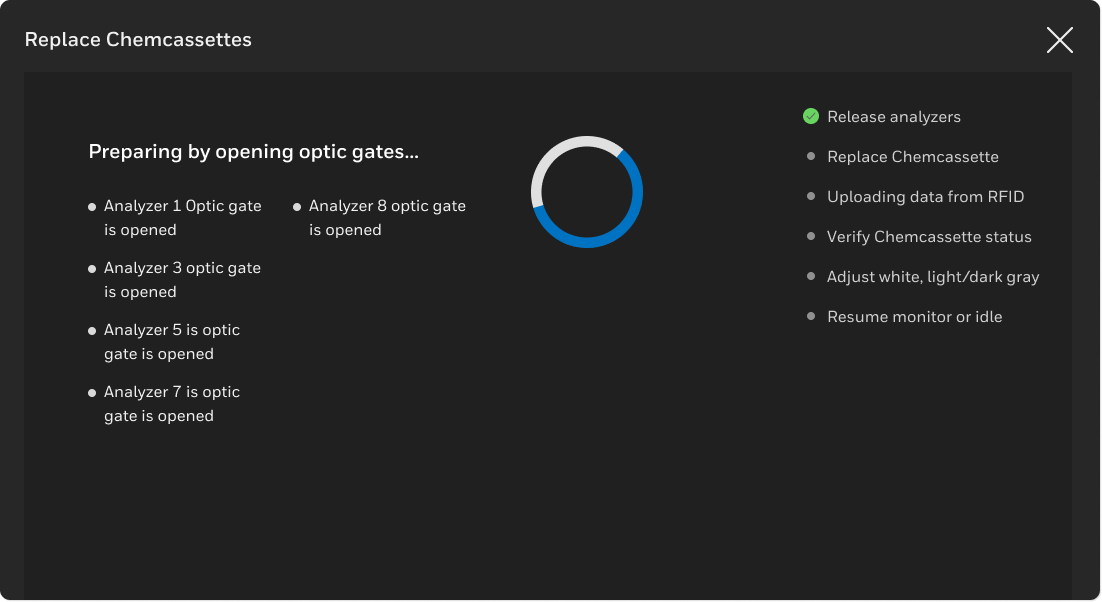
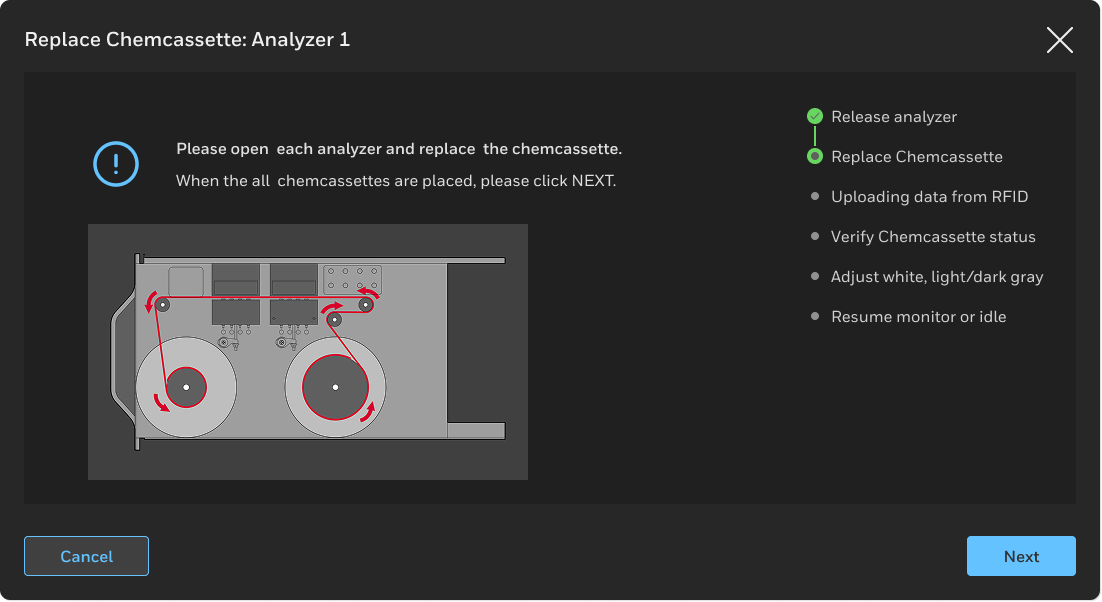
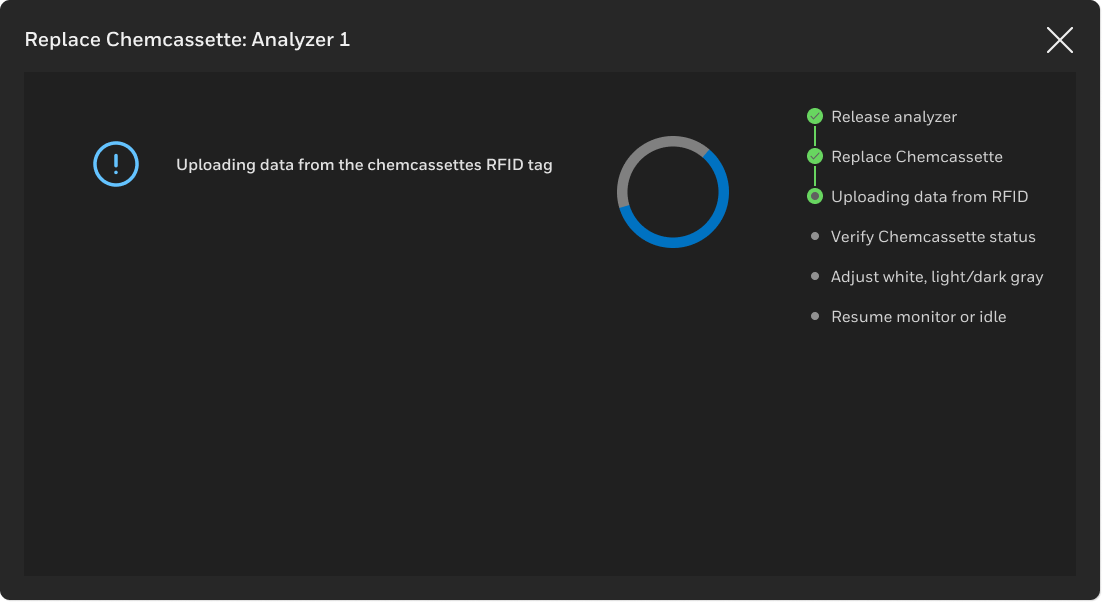
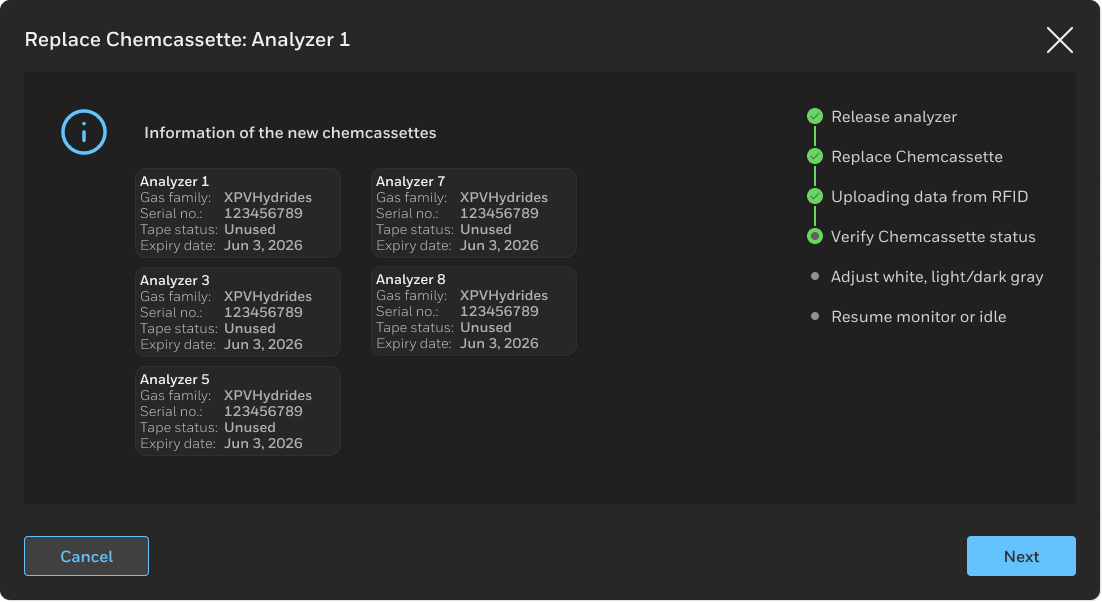
Training and guided maintenance
We heard repetitively that documentation was lacking and that training was needed. We solved this by explicity detailing the steps of complex tasks like replacing Chemcassettes while providing instant and descriptive feedback for any errors. The user can go forward, skip or go back on any step so there is the ability to recover from errors.
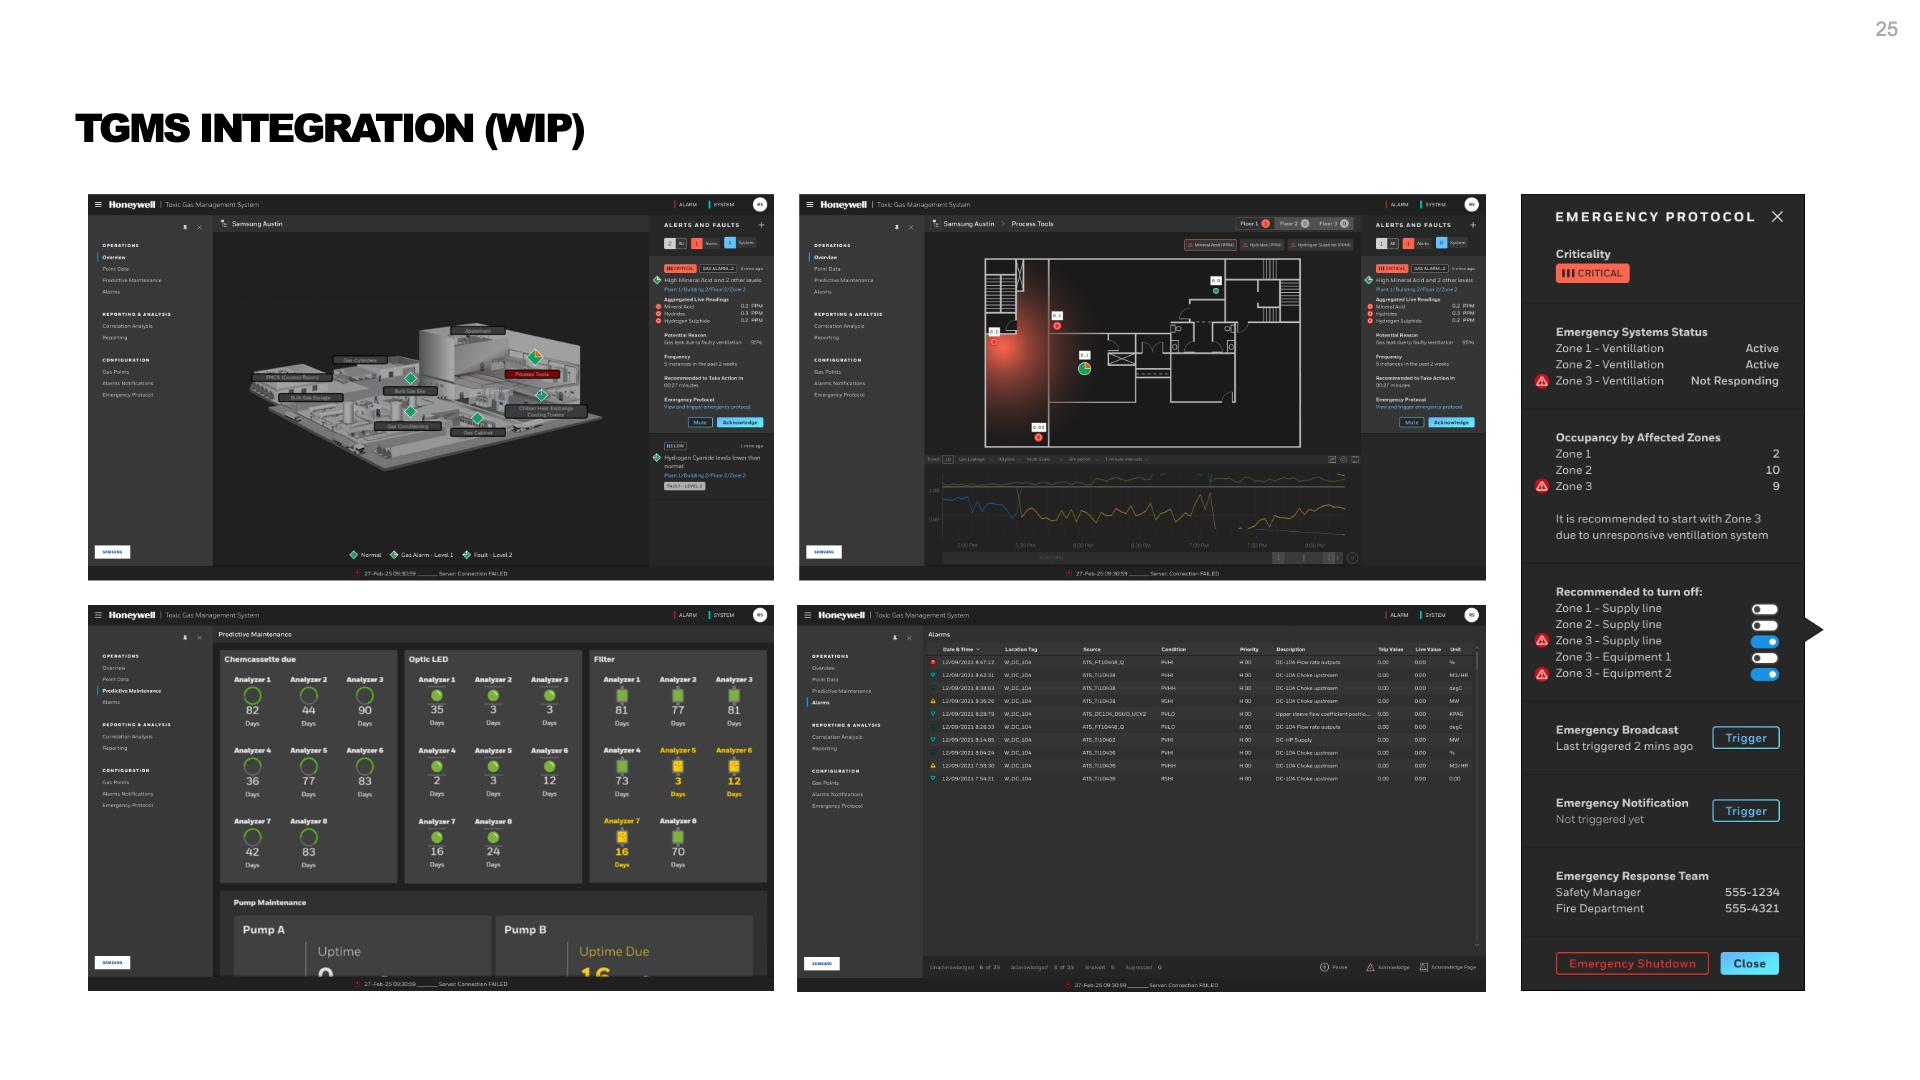
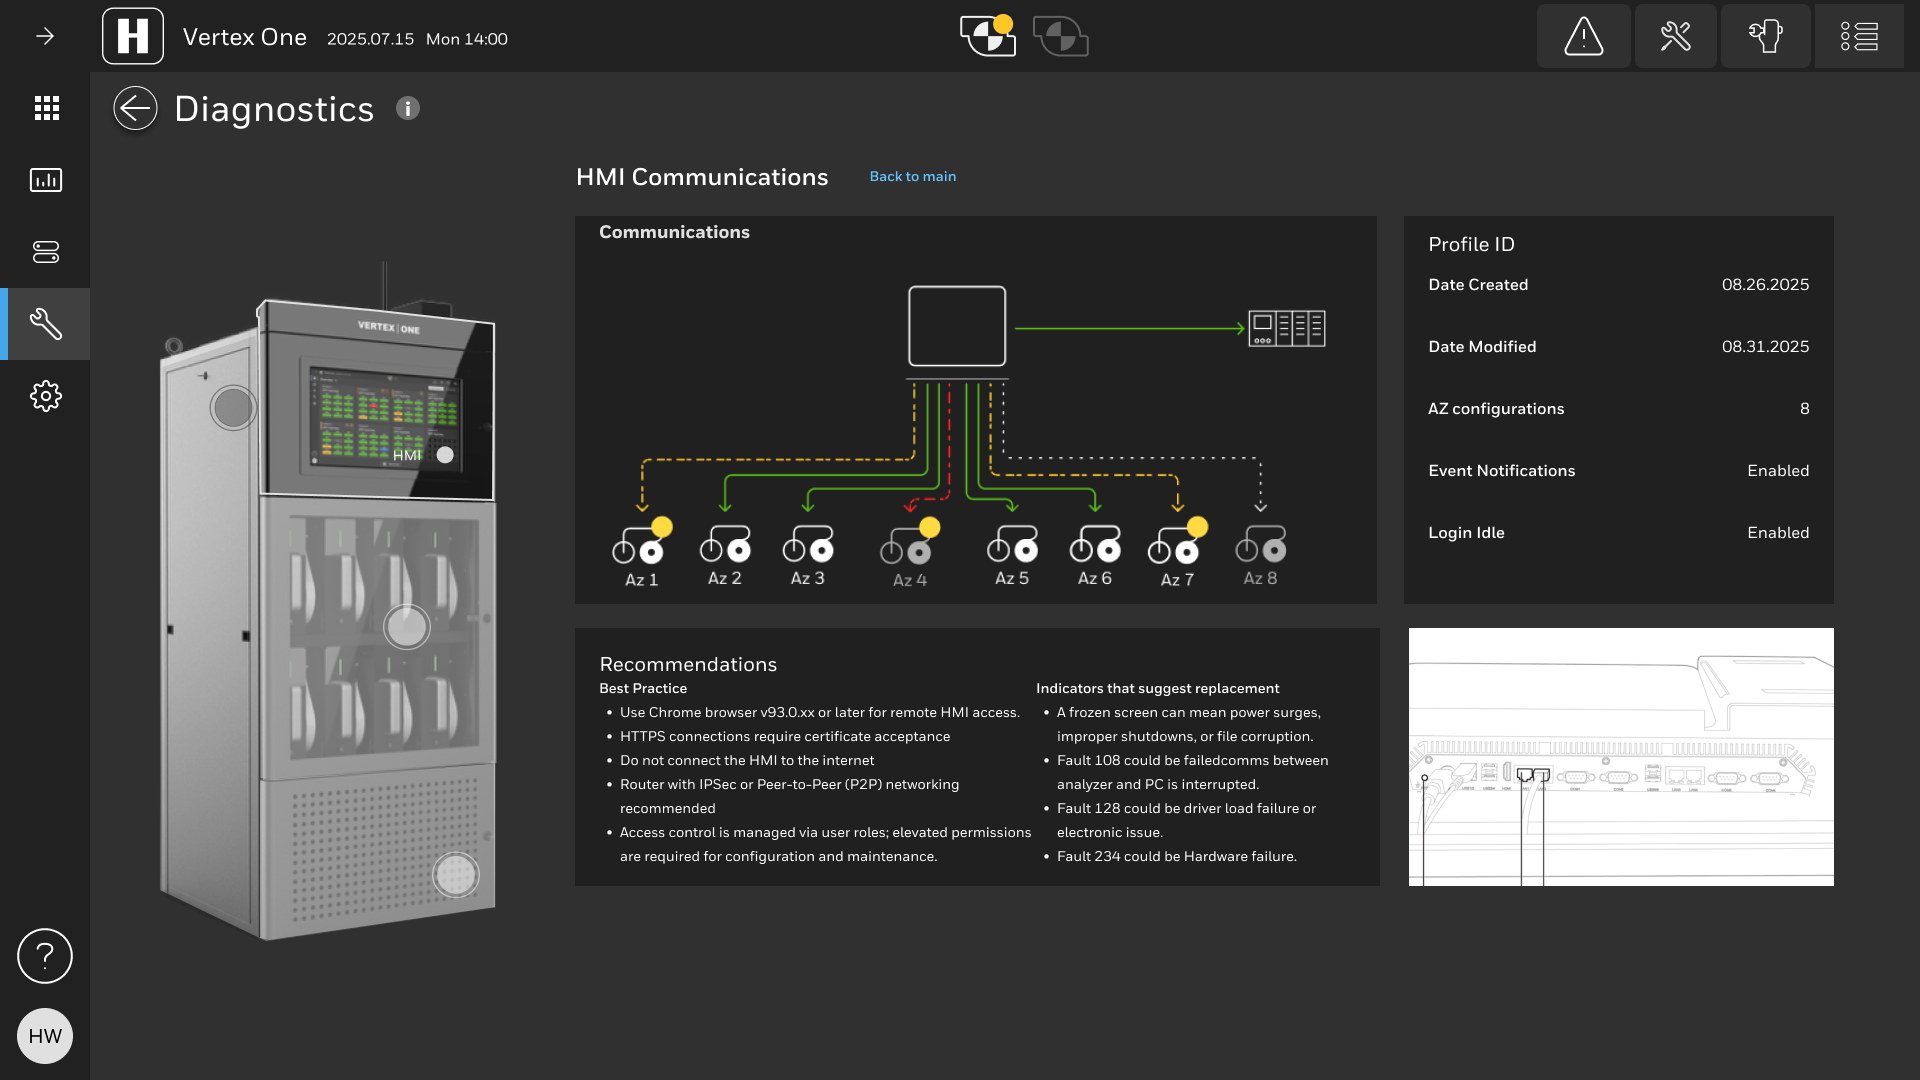
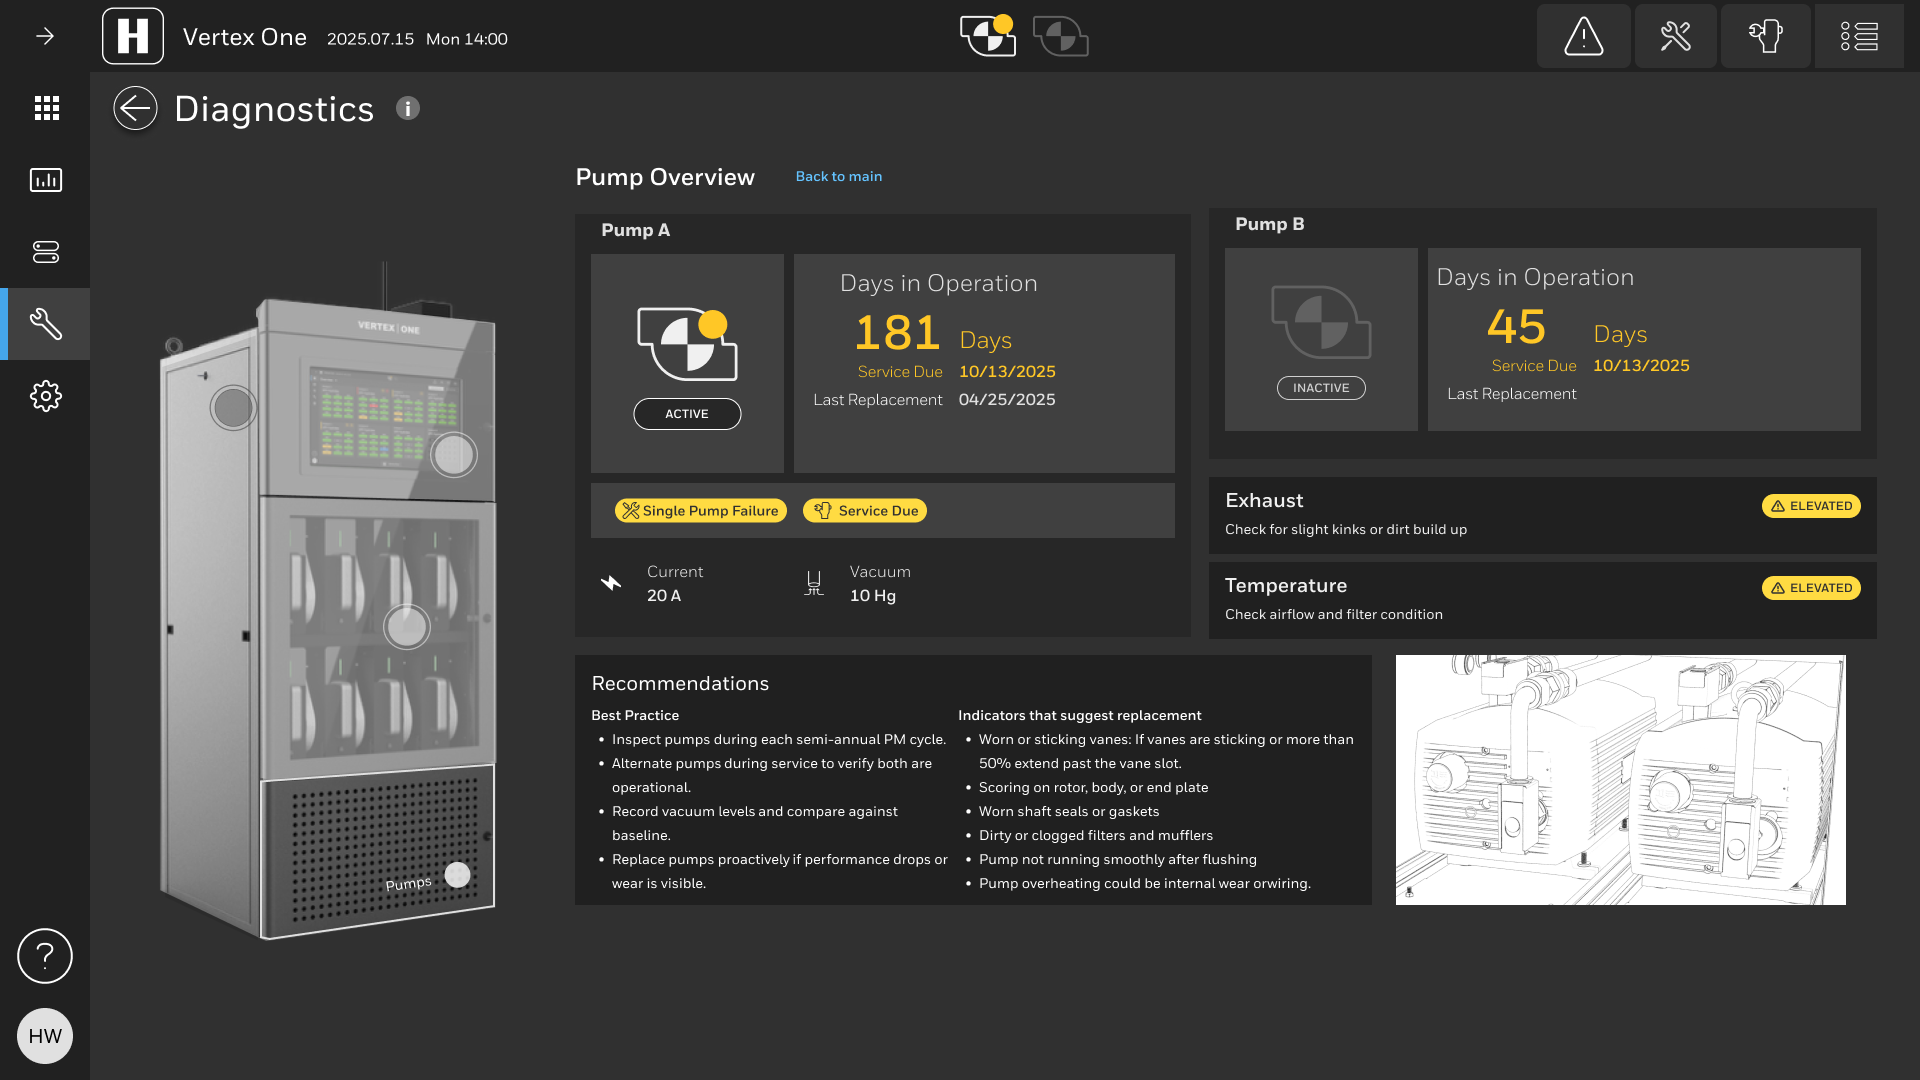
Diagnostics and Recommendations
Ideas circulated around specific recommendations with the rise of artificial intelligence. Internal stakeholders loved this feature including FSEs with many years of experience. The recommendations synthesized form various data sources could be a game changer for Honeywell and allow technicians to spend more time with the customer and less time figuring out how to troubleshoot edge case issues. The digital twin aspect of the diagnostics section received applause from sales, marketing and technicians.
"With the analytics and diagnostics ... This is something we can sell" - Honeywell High Tech President
Prototype
The prototype helped to test the final screens with users and internal stakeholders alike. Every screen was linked up to the prototype and we were able to hook it into a tablet that mimicked the actual Vertex machine.
Versioning, Branching and Annotating
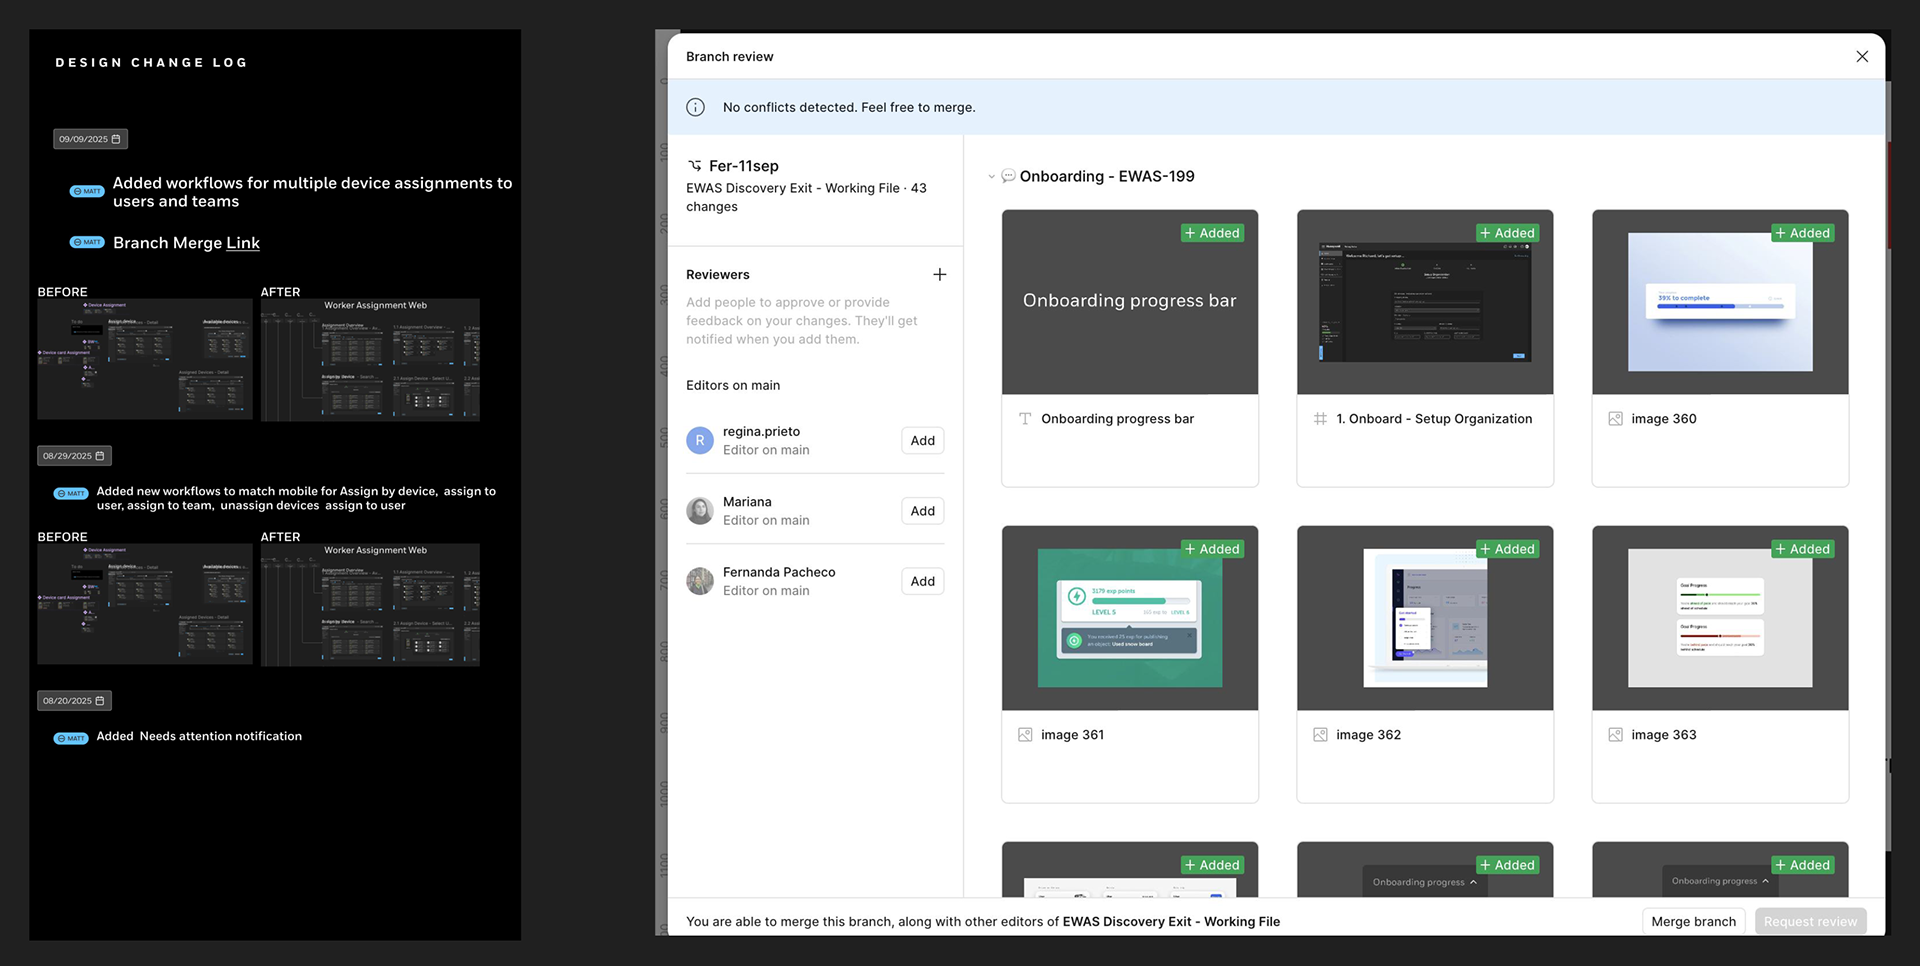
During the dev handoff process it's critical to keep designs updated when there will inevitable be minor tweaks. This is why I implemented a versioning system that included branch and merge functionality similar to GitHub. This native-Figma functionality allowed designers and developers to stay in sync and schedule updates after release in subsequent sprints. Annotating designs is another critical and often overlooked part of the design process. Annotations reduce the amount of back and forth between developers and stakeholders alike.
Keep going and going ...
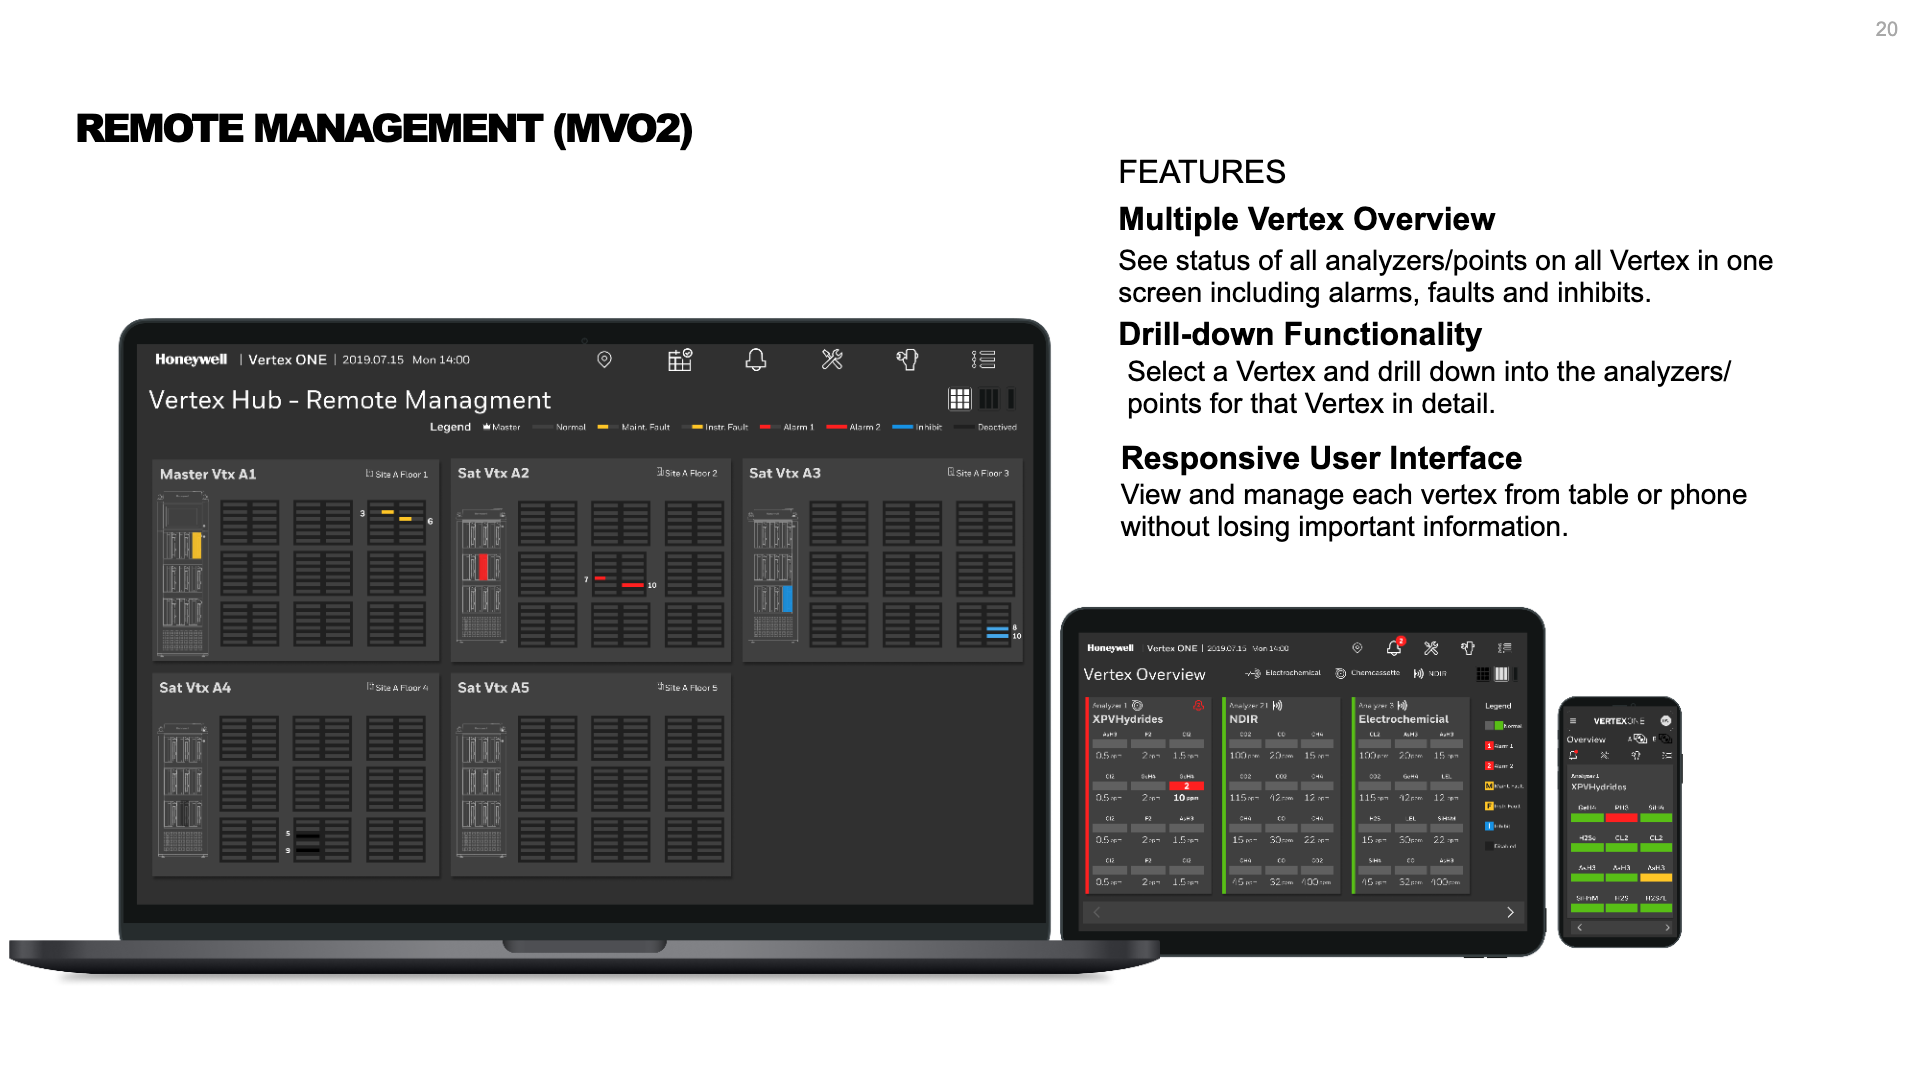
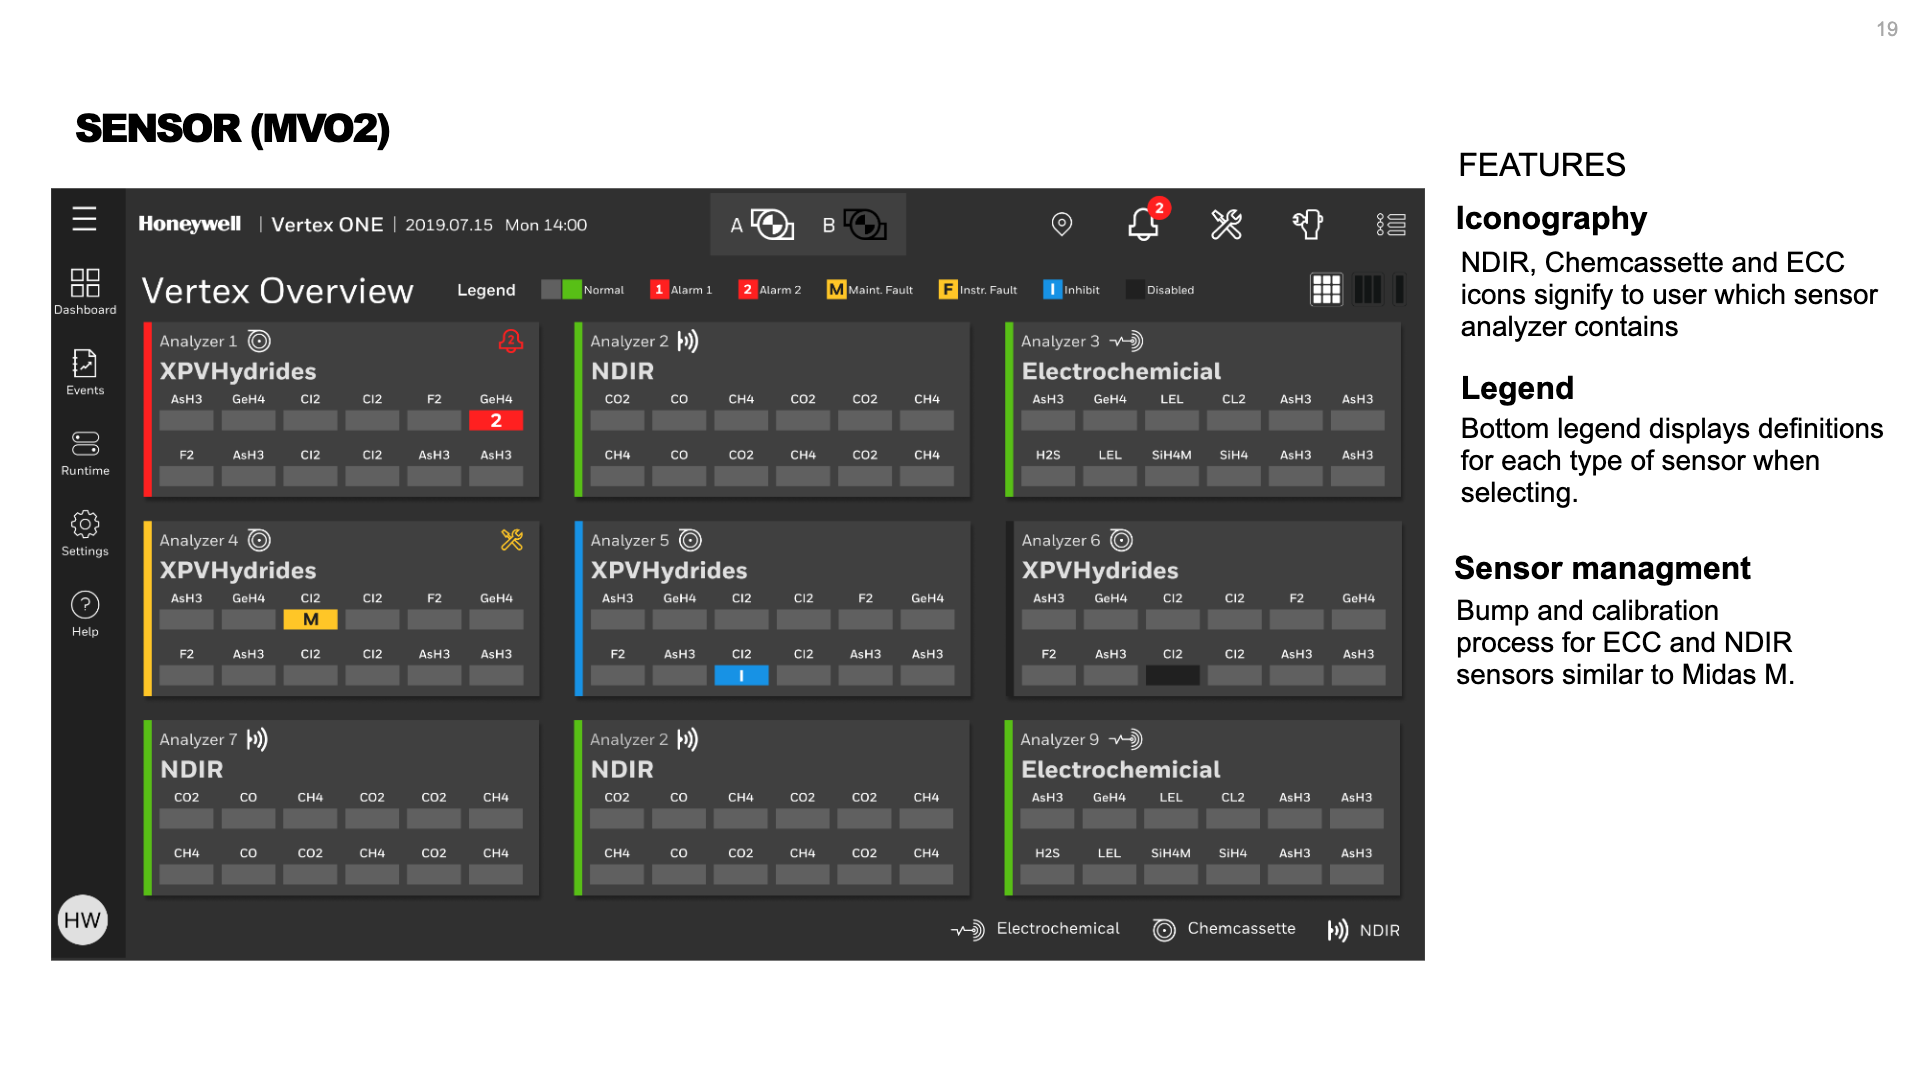
Successful products and upgrades don't happen overnight or even on the first release. There will always be feedback that designers didn't consider or hear about until after the release. There will be more ways to increase revenue after each successful release as customers see tremendous value in premium features. That's the idea behind the new Vertex. Not only do we have plans to release an integration with customer application ecosystems but we also plan to introduce remote management and more AI-based features like more predictive analytics and integrating with Honeywell's gas portfolio and seeing where synergies can lie between Honeywell's extremely diverse product offerings.